Water study: Alabama has 4th highest level of PFAS contaminants
Andrew J. Yawn, Montgomery Advertiser 1:17 p.m. CDT August 20, 2016
Water study: Alabama has 4th highest level of PFAS contaminants
Andrew J. Yawn, Montgomery Advertiser 1:17 p.m. CDT August 20, 2016

(Photo: naumoid, Getty Images/iStockphoto)
A few months after a water advisory was issued for north Alabama due to high levels of PFASs (per- and polyfluoroalkyl substances), a Harvard University study has found that Alabama has the fourth-highest concentration of the chemicals in its water supply behind California, New Jersey and North Carolina.
PFASs are chemicals that repel water and are resistant to fire and oil. Because of these properties, PFASs have been used in household cleaners, fire fighting foams and Teflon cookware.
However, the scientific community is beginning to connect ingestion of PFASs to health issues which is why those shopping for a new non-stick frying pan will most likely see many touting the “PFOA-free” label in reference to perfluorooactanoic acid, a type of PFAS also found in some Alabama water supplies.
PFAS have now been linked to birth defects, cancer, obesity and immune system suppression, and the Harvard-led study found PFASs in the drinking water supplies of 16.5 million Americans.
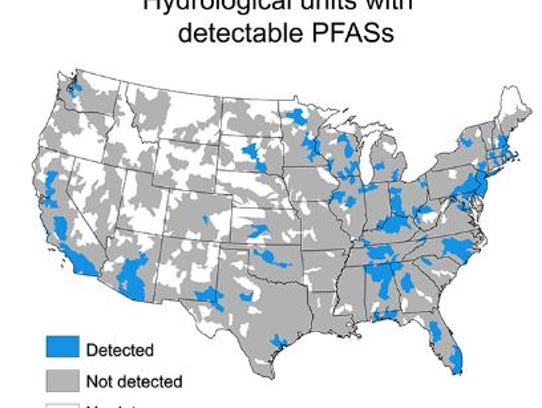
Water supplies where PFASs were detected. (Photo: Environmental Science and Technology Letters)
Drinking water from 13 states accounted for 75 percent of the detections with Alabama having the fourth-highest amount of those 13.
The Alabama Department of Public Health and the Environmental Protection Agency issued a water advisory on May 19 after PFASs were found in eight north Alabama water systems.

"For the last three years, the levels of PFOS, PFOA and emerging contaminants in surface water have been monitored in all drinking water systems serving more than 10,000 people and in selected systems serving fewer people. ADPH will continue to review all studies and recommendations related to ingestion of these chemicals through public water supplies. ADEM is working with the named water systems to collect additional monitoring data where appropriate and to identify methods to reduce the water concentration of PFCs to a level below the final health advisory recommendation," reads the ADPH statement.
The north Alabama contamination has been linked to the 3M plant on the Tennessee River. Not only was 3M pinpointed as a source of PFAS contamination by the Harvard study due to its use of the chemicals in the manufacture of non-stick goods, but the company has also been named a defendant in a federal lawsuit filed by non-profit Tennessee Riverkeeper.
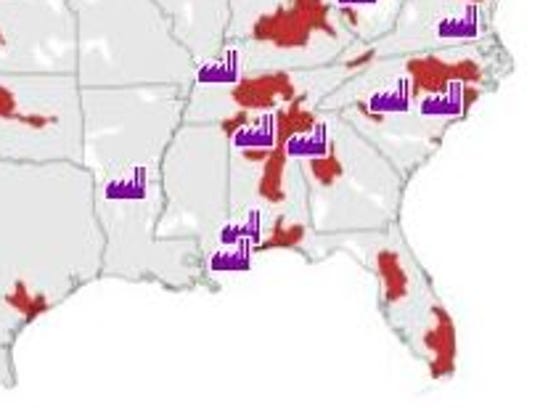
The red areas are water supplies with PFASs and the purple icons indicate manufacturing plants in the area. (Photo: Environmental Science and Technology Letters)
Chemical plant BASF in McIntosh, Ala., was also identified as an origin point for PFASs by the study. Water supplies around military fire training areas, airports and wastewater treatment plants were also found to contain PFASs with public water systems near manufacturing sites having an 81 percent higher chance of being contaminated by PFASs. Military sites increased risk by 35 percent, according to the study.

With at least 100,000 people in Alabama affected by the presence of PFAS-contaminated water, many are looking for a way to filter out the chemicals.
One of the eight Alabama water systems named by the EPA, the West Morgan-East Lawrence Water Authority, has a plan in place to put in a $4 million temporary filter until the permanent filter -- estimated to cost upwards of $30 million -- can be completed in 2019, according to several media reports.
When asked for comment, the EPA would only say that the study will be reviewed by the organization.
The EPA lowered the minimum reporting level of PFASs to 70 parts per trillion this year. After this study, regulation and cleanup of PFASs may get more stringent.
===================


Drinking
water systems serving at least six million Americans have shown levels
of C8 and other similar chemicals higher than a health advisory issued
earlier this year by the U.S. Environmental Protection Agency, according
to a new study published Tuesday by researchers from Harvard University
and several other institutions and groups.
The study, though,
cautions that another 44.5 million Americans rely on private wells that
generally have not been sampled for these chemicals and another 52
million residents are served by small drinking water systems that are
rarely sampled. And, the study further warns, studies continue to
strongly suggest that exposure to these chemicals can make people sick,
even at or below the concentration recommended as acceptable under the EPA health advisory.
“The
EPA advisory limit ... is much too high to protect us against toxic
effects on the immune system,” said study co-author Dr. Philippe
Grandjean of the Harvard School of Public Health. “And the available
water data only reveals the tip of the iceberg of contaminated drinking
water.”
The study, published in the peer-review journal Environmental Science and Technology Letters, comes amid growing new attention for the potential threats from C8 and similar chemicals in the months following their discovery in water systems in New York and Vermont
— a development that has driven political and media focus on the issue
as residents near a DuPont Co. plant in Wood County, West Virginia, have waited for years for EPA to publish its new guidance.
The
mid-Ohio Valley region around Parkersburg has for years been at the
center of a simmering controversy over C8 pollution that has in recent
months exploded into a larger national issue, with more intense media
coverage, growing concerns in a variety of communities, and verdicts against DuPont in the first of thousands of pending personal injury cases to go to trial in a federal court in Ohio.
C8,
which is also known as perfluorooctanoate acid, or PFOA, was made and
used at DuPont’s Washington Works plant south of Parkersburg as a
processing agent to make Teflon and other nonstick products,
oil-resistant paper packaging and stain-resistant textiles.
DuPont and other companies have agreed on a voluntary phase-out of the chemical,
but researchers noted in this week’s study that declines in production
in the U.S. and Europe have been offset by increases in developing
regions such as Asia. Scientists have also been increasingly concerned
about chemical contamination of consumer products,
and the new study provides important details about the potential
threats from waste disposal practices and varying uses of the
substances.
The study used computer mapping techniques to try to
pinpoint the locations of contaminated drinking water supplies relative
to potential sources of C8 contamination. Researchers said that they
were hampered by the fact that regulators keep exact locations of
drinking water intakes confidential, citing concerns about potential
terrorist attacks. Instead of looking specifically at intake locations,
the study focused on broader areas around those intakes, a move that may
have missed impacts on groundwater, where contaminated plumes could be
much smaller.
Researchers found that higher levels of chemicals
were found in water supplies that were located closer to industrial
sites, or to military bases or airports where firefighting foams
containing some of the chemicals could have been used in emergeny
drills. They also found higher levels in water supplies located near
wastewater treatment facilities, which are generally not capable of
removing the contamination as part of routine treatment.
Co-authors
of the study included scientists from the University of California at
Berkeley, the University of Rhode Island, the Colorado School of Mines,
the Silent Spring Institute, the Green Science Policy Institute, the
Environmental Working Group and EPA.
A second study that was also published Tuesday in the journal Environmental Health Perspectives
added to previous evidence about immune system impacts of these
chemicals, connecting early life exposure to reduced immune function.
Other recently published papers connected elevated exposure levels in women to shorter duration of breastfeeding, found higher levels of the chemicals in the blood of California women whose drinking water was contaminated, and found lower levels of growth and sex hormones in childen exposed to the chemicals.
Study: At least 6 million at risk from PFOA chemical family
Ken Ward Jr. , Staff Writer
August 9, 2016
==================

Michael
Reaves, The Denver Post A water tower overlooks the community of
Security in the foreground of Pike’s Peak on June 8, 2016. A invisible
toxic chemical has been discovered in the drinking water that affects
70,000 people in the communities south of Colorado Springs.
By The Associated Press
UPDATED: August 18, 2016 at 3:34 pm
By JENNIFER McDERMOTT, Associated Press
The
U.S. Air Force is changing the foam it uses to fight fires because of
concerns the substance has contaminated groundwater and spread to
drinking water at some military sites.
The Air Force said it
awarded a $6.2 million contract on Monday to replace the firefighting
foam with an “environmentally responsible foam” to reduce the risk of
possible contamination of soil and groundwater.
The current foam
is used where potentially catastrophic fuel fires can occur, such as in
a plane crash, because it can rapidly extinguish the flames. It
contains perfluorooctane sulfonate and perfluorooctanoic acid, or PFOS
and PFOA, which are both considered emerging contaminants by the U.S.
Environmental Protection Agency and have been linked to cancer and other
illnesses.
The EPA issued stricter guidelines for human
exposure to these chemicals in May, after years of pressure from public
health experts and advocacy groups. The agency said the new limits were
prompted by recent scientific studies linking the chemicals to
testicular and kidney cancers, as well as birth defects and liver
damage.
The chemicals have been detected in water at some
current and former bases where the military has conducted fire or crash
training. In Colorado, health officials said Wednesday that it’s highly
likely that trace amounts of toxic chemicals found in three drinking
water systems came from firefighting foam used at nearby Peterson Air
Force Base, where firefighters used the foam in training exercises.
The new formulation does not have PFOS and contains little or no PFOA.
Mark
Kinkade, spokesman for the Air Force Civil Engineer Center, said the
Air Force has completed preliminary assessments at all of its sites and
is now sampling groundwater and soil. He said the Air Force still has “a
lot of work to do” but at the same time it’s working to protect human
health and the environment by changing foams and taking other steps to
ensure that foam is used safely.
Air Force fire chief James
Podolske Jr. said the service must continue to use foam in its defense
operations to protect people, weapon systems and infrastructure, but it
will “do so in a more environmentally responsible way that also makes
our operations safer for the public.”
The Air Force will no
longer use the foam in training exercises, and the service plans to
replace all foam in fire vehicles and at fire stations with the new
formula by the end of this year. It also is retrofitting its aircraft
rescue and firefighting vehicles with equipment that lets firefighters
conduct vehicle operational checks and required annual foam tests
without discharging the foam into the environment.
The Defense
Department said earlier this year it’s examining hundreds of sites
nationwide for potential contamination from the foam. It wasn’t
immediately clear Thursday whether the Navy and Army are changing foams,
too.
A Defense Department spokesman said the department is
disposing of older foams, wherever possible, buying new foams that do
not contain PFOS and investing in research to develop a foam that
doesn’t contain the chemicals and can be certified to meet military
standards.
PFOA has also been used in consumer products, such as
nonstick pans, stain-resistant carpets and microwave popcorn bags, and
has been found in the tap water of dozens of factory towns near
industrial sites where it was manufactured.
============================
Michael
Reaves, The Denver Post A water tower overlooks the community of
Security in the foreground of Pike’s Peak on June 8, 2016. A invisible
toxic chemical has been discovered in the drinking water that affects
70,000 people in the communities south of Colorado Springs.
By The Associated Press
PUBLISHED: August 17, 2016 at 4:56 pm | UPDATED: August 17, 2016 at 6:16 pm
By Dan Elliott, The Associated Press
The
military said Wednesday it has identified six places on an Air Force
base in Colorado where firefighting foam containing toxic chemicals may
have escaped into the environment and made its way into drinking water
in two nearby communities.
Engineers who conducted the review
recommended a follow-up investigation at Peterson Air Force Base, where
the foam was used in firefighting drills and equipment tests. It
contained perfluorinated compounds, or PFCs, which have been linked to
prostate, kidney and testicular cancer, along with other illnesses.
The military is checking bases nationwide for possible releases of the foam into the environment.
It
wasn’t immediately clear what the next phase of the investigation at
Peterson would entail. The Air Force previously announced plans to drill
monitoring wells and take soil samples to determine whether the
chemicals were seeping into underground water from the base.
The
PFCs were found in three water systems serving about 69,000 people in
the city of Fountain and an unincorporated community called
Security-Widefield. The chemicals have not been definitively traced to
Peterson, but its proximity to the affected systems spurred the
investigation.
The PFCs also were widely used in non-stick
coatings on cookware and in other applications. The U.S. Environmental
Protection Agency ordered water systems nationwide to test for the
compounds between 2013 and 2015.
The Fountain, Security and
Widefield districts found the chemicals at levels that exceed the EPA’s
suggested limits. PFCs didn’t show up in any other districts.
Colorado
health officials have said the communities have higher rates of kidney
cancer than surrounding populations, but the evidence was not sufficient
to definitively blame PFCs. They noted that the residents also have
higher rates of obesity and smoking, which are linked to cancer.
The
Air Force previously agreed to spend $4.3 million to install filters in
the three systems to remove PFCs. Contractors were still working out
the details, Peterson spokesman Steve Brady said.
The Security
Water District has shifted almost entirely to surface water — from
rivers and lakes — since the PFCs were found, Manager Roy Heald said
Wednesday. Previously, about half the district’s water came from wells
and half from surface water.
Heald expects the district to use surface water entirely soon, following modifications to the system.
The
Fountain Water Department has not used wells since October and got
through this summer’s peak demand period entirely on surface water,
Utilities Director Curtis Mitchell said.
The director of the Widefield water system wasn’t immediately available to comment, his staff said.
=======================
DEADLY FOAM: the National Fire Laboratory is the source of
perfluoroalkylated chemicals (PFAS) that contaminated the drinking
water in Mississippi Mills, Ontario


Fire lab source of chemicals found in drinking water, NRC confirms
'This is the first time they've actually owned that piece of the mystery,' says mayor
By Ashley Burke, CBC News Posted: Jul 08, 2016 5:00 AM ET Last Updated: Jul 08, 2016 6:22 AM ET

Media toured the National Fire Lab in Mississippi Mills in February 2012. (CBC News)
Government
officials have confirmed the National Fire Laboratory is the source of
chemicals that contaminated the drinking water in Mississippi Mills,
Ont.
Homeowners living near the facility found out in December
2015 that perfluoroalkylated substances, or PFAS, were discovered in
their tap water. It's the same chemical often found in firefighting
foams.
'They admitted they were essentially ground zero of the problem.' - Mississippi Mills Mayor Shaun McLaughlin
In
an emailed statement to CBC News, the National Research Council
confirmed Thursday that "ongoing environmental assessments have
indicated that PFAS found in the nearby residential wells originated
from the National Fire Laboratory site.
"Since identifying PFAS
at the National Research Council's National Fire Laboratory, our focus
has been on carrying out an effective and thorough environmental
assessment and on the continued safeguarding of the health and safety of
residents and employees," the statement said.
"They admitted
they were essentially ground zero of the problem," said the
municipality's mayor, Shaun McLaughlin. "This is the first time they've
actually owned that piece of the mystery."
Back in 2013, the NRC knew contaminants were found in the groundwater from drill sites close to the facility.
Two
years later, the government department started delivering bottled water
to some neighbouring homes and paying for charcoal water filtration
systems.

J.D. Heffern, his wife and three daughters learned their drinking water may be contaminated in December 2015. (Submitted Photo)
Residents pushing for answers
Ever
since, residents in more than 70 homes in the community of Ramsay
Meadows have been pushing for answers. The NRC says it's been carrying
out environmental assessments.
"Results to date indicate low to
no detection of PFAS in residential water..." said the NRC in a
statement to CBC News. "According to Health Canada, there are no
expected health impacts over a lifetime of exposure, if levels of PFAS
in drinking water fall below the applicable Health Canada screening
values."
A working group representing the Ramsay Meadows
homeowners says they appreciate the NRC being honest about the results.
The department's acting president, Maria Aubrey, met with two of the
residents at the end of June.
"We are kind of taken aback a
little bit," said chairperson J.D. Heffern. "They've come back and said
here's the evidence. We've done testing to the west of the facility,
we've done testing in various places and our conclusion is the National
Fire Lab is in fact the source of the contaminants in a plume-like
formation coming towards Ramsey Meadows."
Lingering concerns over health
Residents who live near the fire lab don't know how long they were exposed to the chemicals and what the impact could be.
'We don't know about the long-term effects.' - J.D. Heffern, chairperson of residents' working group
Scientific information is limited on PFAS, Health Canada says.
But
in studies done on animals, "high levels of PFAS have been linked with
negative health effects ... including liver damage and impacts on
neurological development," the agency's fact sheet says.
In
humans, short-term exposure to PFAS at levels slightly above the safety
threshold isn't expected to have health effects, according to Health
Canada, but the agency does not define what constitutes short- or
long-term exposure.
"We don't know about the long-term effects," said Heffern.
A working group for Ramsay Meadows residents is meeting with Health Canada on July 12.

There is no public access to the NRC fire research lab in Mississippi Mills. (Stu Mills/CBC)
==============================
Perfluoroalkyl substances (PFAS) are a large group of man-made
chemicals that have been used in industry and consumer products
worldwide since the 1950s.
In the United States, making and using these
chemicals in consumer products has greatly decreased during the last 10
years, but people can still be exposed to PFAS because they are still
present in the environment.
Scientists have studied how PFAS affect
animals’ health but are still trying to understand how exposure to PFAS
affects human health. Over the last decade, interest in PFAS has been
growing. ATSDR and our state health partners are investigating exposure
to PFAS at a number of sites.
PFAS are heat, oil, grease, and water resistant.
The two best known groups of this family of chemicals are the
perfluorocarboxylic acids (PFCAs), which include perfluorooctanoic acid
(PFOA, sometimes called C8), and the perfluorosulfonates (PFSAs), which
include perfluorooctane sulfonate (PFOS).
PFCAs and PFSAs do not break
down easily in the environment. They also bioaccumulate, or build up, in
the blood and organs of exposed humans and animals and remain there for
extended periods of time.
Some PFAS are precursors to PFCAs and PFSAs and can break down to those chemicals in the body or the environment.
The largest manufacturer of PFOS voluntarily stopped producing it in
2002. However, other countries still produce PFOS, and it can be
imported into the United States in limited quantities.
In 2006, EPA and
major companies in the PFAS industry launched the 2010/2015 PFOA
Stewardship Program. Companies participating in the program are working
to stop producing PFOA and related chemicals by 2015. These companies
include Arkema, Asahi, BASF Corporation (successor to Ciba), Clariant,
Daikin, 3M/Dyneon, DuPont, and Solvay Solexis.
List of Perfluorosulfonates and Perfluorocarboxylic Acids and Their Abbreviations
|
Chemical
|
Abbreviation
|
Chemical Abstracts Service Registry Number (CAS No.)
|
Chemical Formula
|
| Perfluorosulfonates (PFSAs) |
| Perfluorobutane sulfonate |
PFBuS
|
375-73-5
|
C4HF9O3S
|
| Perfluorodecane sulfonate |
PFDS
|
335-77-3
|
C10HF21O3S
|
| Perfluoroheptane sulfonate |
PFHpS
|
375-92-8
|
C7HF15O3S
|
| Perfluorohexane sulfonate |
PFHxS
|
432-50-7
|
C6HF13O3S
|
| Perfluorooctane sulfonate |
PFOS
|
1763-23-1
|
C8HF17O3S
|
| Perfluorooctanesulfonamide |
PFOSA
|
754-91-6
|
C8H2F17NO2S
|
|
| Perfluorocarboxylic acids (PFCAs) |
| Perfluorobutanoic acid |
PFBA
|
375-22-4
|
C4HF7O2
|
| Perfluorodecanoic acid |
PFDA
|
335-76-2
|
C10HF19O2
|
| Perfluorododecanoic acid |
PFDoA
|
307-55-1
|
C12HF23O2
|
| Perfluoroheptanoic acid |
PFHpA
|
375-85-9
|
C7HF13O2
|
| Perfluorohexanoic acid |
PFHxA
|
307-24-4
|
C6HF11O2
|
| Perfluorononanoic acid |
PFNA
|
375-95-1
|
C9HF17O2
|
| Perfluorooctanoic acid |
PFOA
|
335-67-1
|
C 8HF15O2
|
| Perfluoroundecanoic acid |
PFUA
|
2058-94-8
|
C11HF21O2
|
======================================
Drinking
water contamination with poly- and perfluoroalkyl substances (PFASs)
poses risks to the developmental, immune, metabolic, and endocrine
health of consumers. We present a spatial analysis of 2013–2015 national
drinking water PFAS concentrations from the U.S. Environmental
Protection Agency’s (US EPA) third Unregulated Contaminant Monitoring
Rule (UCMR3) program. The number of industrial sites that manufacture or
use these compounds, the number of military fire training areas, and
the number of wastewater treatment plants are all significant predictors
of PFAS detection frequencies and concentrations in public water
supplies. Among samples with detectable PFAS levels, each additional
military site within a watershed’s eight-digit hydrologic unit is
associated with a 20% increase in PFHxS, a 10% increase in both PFHpA
and PFOA, and a 35% increase in PFOS. The number of civilian airports
with personnel trained in the use of aqueous film-forming foams is
significantly associated with the detection of PFASs above the minimal
reporting level. We find drinking water supplies for 6 million U.S.
residents exceed US EPA’s lifetime health advisory (70 ng/L) for PFOS
and PFOA. Lower analytical reporting limits and additional sampling of
smaller utilities serving <10000 individuals and private wells would
greatly assist in further identifying PFAS contamination sources.
Introduction
Poly-
and perfluoroalkyl substances (PFASs) make up a large group of
persistent anthropogenic chemicals used in industrial processes and
commercial products over the past 60 years.(1)
Widespread use and extreme resistance to degradation have resulted in
the ubiquitous presence of these compounds in the environment. The
2011–2012 U.S. National Health and Nutrition Examination Survey reported
detectable serum PFAS concentrations in virtually all individuals
(97%).(2, 3) Human PFAS exposure has been linked to cancer, elevated cholesterol, obesity, immune suppression, and endocrine disruption.(4-6)
Health concerns in the early 2000s prompted manufacturers in Europe and
North America to phase out production of some long-chain PFASs.(7-10) Declines in production of these compounds have been offset by increases in developing regions such as Asia.(8) Limited available data suggest widespread exposure to replacement (short-chain) PFASs may also adversely affect human health.(11, 12)
Human PFAS exposure includes dietary sources, household dust, air, and drinking water.(13, 14) Exposure from drinking water is a serious concern because of the high aqueous solubility of many PFASs.(15, 16) Relatively low PFAS concentrations can lead to elevated exposures in the general population.(17) Elevated PFAS concentrations in U.S. drinking water have been reported in numerous regions,(15, 16, 18, 19) especially near industrial sites that produce or use them.(6, 16, 20)
For example, perfluorooctanoic acid (PFOA) concentrations 190-fold
higher than the lifetime health advisory (70 ng/L) recommended by the
U.S. Environmental Protection Agency (US EPA)(21)
were measured in drinking water near a fluorochemical facility in
Washington, WV, where PFOA was used in fluoropolymer production.(18)
Many
civilian airports and military fire training areas have been
contaminated by PFASs contained in aqueous film-forming foams (AFFFs)
that are widely used during firefighting training activities.
Groundwater and surface waters surrounding these sites containing PFAS
concentrations that are 3–4 orders of magnitude higher than the US EPA
health advisory level for drinking water have been reported.(22, 23)
Wastewater treatment plants (WWTPs) are another important PFAS source
because these compounds are not removed by standard treatment methods(24) and labile precursors biodegrade, increasing concentrations in effluent relative to influent.(25, 26)
Land application of approximately half of the biosolids generated by
WWTPs may contribute to human exposure through subsequent contamination
of water, food, livestock, and wildlife.(27)
Understanding
nationwide PFAS exposures from drinking water is important for
identifying potentially vulnerable populations. However, previous
studies have mainly focused on individual point sources of PFAS
contamination and site-specific drinking water exposures.(15, 16)
Here we develop a statistical framework for investigating whether
increased PFAS concentrations in drinking water are associated with the
number of point sources within a watershed (represented by an
eight-digit hydrologic unit code, hereafter abbreviated HUC). We used
publicly available drinking water concentration data for six PFASs from
the US EPA’s third Unregulated Contaminant Monitoring Rule (UCMR3),
including perfluorobutanesulfonic acid (PFBS), perfluorohexanesulfonic
acid (PFHxS), perfluoroheptanoic acid (PFHpA), PFOA,
perfluorooctanesulfonic acid (PFOS), and perfluorononanoic acid (PFNA) (Table S1).(28)
We discuss the utility of the UCMR3 database for identifying sources of
PFASs to U.S. drinking water supplies, locations of vulnerable
populations, and priorities for future monitoring.
Methods
Drinking Water Data
Our
analysis included analytical results for six PFASs in 36149 drinking
water samples from the US EPA’s UCMR3 program collected between January
2, 2013, and December 9, 2015.(28)
Samples cover all 4064 public water supplies serving >10000
individuals. Data are also available for 800 public water supplies
serving <10000 individuals, but this represents only a small fraction
(0.5%) of the 144165 in this category. Minimum reporting levels (MRLs)
for the six PFASs analyzed are listed in Table S1.
One limitation of the UCMR3 database is that national data on system intakes for public water supplies are classified,(29)
making it difficult to place them within a specific hydrological
network. We therefore extracted the zip codes for areas served and
aggregated data within eight-digit HUCs(30)
to capture the most detailed hydrologic information that exceeds the
spatial resolution of PFAS data (zip code areas). We used the highest
reported PFAS concentrations when multiple systems were located within a
single zip code and/or when multiple zip code areas were located within
the same HUC.
PFAS Point Sources
Our spatial analysis (Figure S1) included point source information for (a) 16 industrial sites listed in the US EPA’s 2010/2015 PFOA Stewardship Program (Table S2),(31) (b) 8572 WWTPs,(32) (c) 290 military fire training areas that contain 664 military fire training sites,(33)
and (d) 533 civilian airports that are compliant with Title 14 Code of
Federal Regulations, Part 139 for personnel trained in the use of AFFF
(hereafter termed “AFFF-certified airports”).(34)
PFASs produced and/or used vary across industrial sites, and not all
compounds were associated with all sites. For example, a fluorochemical
manufacturing facility in Decatur, AL, produced both PFOS and PFOA,(35) while only PFOA was used in the manufacturing process of another fluorochemical production facility in Parkersburg, WV.(36)
We conducted a sensitivity analysis to examine the potential production
misclassification bias by limiting industrial sites to include the ones
that only produced or used each specific compound (Table S3).
We used the Google Maps application program interface (API) to geocode
coordinates based on addresses. Potentially important PFAS sources such
as landfills, biosolids, and small industrial PFAS users could not be
included in this analysis because comprehensive geospatial data are not
available.
Spatial and Statistical Analysis
We
used ArcMap 10.3.1 (ESRI) to explore statistical differences between
the number of point sources in eight-digit HUCs with PFAS levels above
and below the level of detection. We developed a multivariate spatial
regression model for watersheds with detectable PFASs that adjusts for
correlations and co-location among point sources. A natural log
transformation was used to normalize the distribution of individual
PFASs. PFNA and PFBS were excluded from the spatial regression analysis
due to a low detection frequency (15 and 14 of 1601 watersheds,
respectively). We used Moran’s I statistic to test for spatial
dependence in the model residuals from an ordinary least-squares (OLS)
regression and correct for spatial dependence in the final spatial
regression model. Akaike Information Criterion(37)
was used to compare the OLS and spatial regression models, where a
lower value implies a better model fit. A series of cross-validation
tests were also completed to assess the predictive capacity and
stability of the final set of models. The OLS and spatial regression
models were constructed using GeoDa 1.6 software,(38) and cross-validation was implemented in R version 3.1.3.
Results and Discussion
PFASs in U.S. Drinking Water
PFASs
were detected at or above the MRLs in 194 of 4864 public water
supplies, serving 16.5 million residents in 33 different states, three
American territories (American Samoa, Northern Mariana Islands, and
Guam), and the Salt River Pima-Maricopa Indian Community. Drinking water
from 13 states accounted for 75% of detections, including, by order of
frequency of detection, California, New Jersey, North Carolina, Alabama,
Florida, Pennsylvania, Ohio, New York, Georgia, Minnesota, Arizona,
Massachusetts, and Illinois (Figure 1).
Detection frequencies for PFASs across the 4864 public water supplies
were 2.2% for PFOA, 2.0% for PFOS, 1.7% for PFHpA, 1.1% for PFHxS, and
<0.003% for others.
Many
detectable PFAS concentrations in the UCMR3 database are above chronic
drinking water and water quality standards for other regions (i.e.,
surface water European Union, PFOS, <1 ng/L; drinking water Sweden,
sum of seven PFASs, <90 ng/L; groundwater State of New Jersey, PFNA,
<10 ng/L; drinking water State of Vermont, sum of PFOS and PFOA,
<20 ng/L).(39-42)
A recent analysis developed a benchmark dose for immunotoxicity in
children and suggested a drinking water limit of approximately 1 ng/L
for PFOS and PFOA.(26) Data from rodents that measured sensitive end points such as mammary gland development support a similar level.(26)
Six
million people were served by 66 public water supplies that have at
least one sample at or above the US EPA’s 2016 health advisory for PFOS
and PFOA (70 ng/L individually or combined). Concentrations ranged as
high as 349 ng/L for PFOA (Warminster, PA), 1800 ng/L for PFOS (Newark,
DE), and 56 ng/L for PFNA (Woodbury, NJ).
The detection frequency in drinking water sourced from groundwater was more than twice that from surface water (Table S4). Long-chain PFASs(43)
(PFHxS, PFOS, PFOA, and PFNA) were more frequently detected in
groundwater, and short-chain compounds (PFHpA and PFBS) were detected
more frequently in surface waters. This may be due to both the original
mode of environmental release (as an aerosol, application to soil, and
aqueous discharge) and the inverse relationship between PFAS mobility
and chain length.(44)
The MRLs (10–90 ng/L) in the UCMR3 database are up to 2 orders of
magnitude higher than the limit of quantitation in most published
studies,(45-49) and more than 10 times higher than the drinking water limit (1 ng/L) suggested by human and animal studies.(26, 50) Because PFASs are detectable in virtually all parts of the environment,(5, 7, 9, 13, 14, 20, 44, 51) we infer that the large fraction of samples below reporting limits (Table S4) is driven in part by high MRLs.
Sources Surrounding Locations with Detectable PFASs
Our analysis indicates point sources are significantly more abundant in HUCs with detectable PFASs [two-sided t test, p < 0.05 (Table 1 and Figure S2)].
This includes drinking water samples from 1601 of the 2158 total U.S.
HUCs. For example, HUCs with detectable PFOA levels (8% of the total)
have more industrial sites, military fire training areas, AFFF-certified
airports, and WWTPs than those with concentrations below detection.
These trends can be observed across all PFASs. Similarly, HUCs with
point sources have higher detection frequencies for PFASs (Table S5).
For example, the presence of a military fire training area within a HUC
increases the frequency of detection of at least one PFAS from 10.4% to
28.2%. One caveat is that imprecise information about public water
supply intakes can cause misclassification bias. Systems that draw water
upstream from point sources, such as Minneapolis and St. Paul in
Minnesota, may not actually be affected as indicated by the aggregated
spatial analysis.
| mean abundancea within eight-digit hydrologic unit codes |
|---|
| compound | major industrial sitesb | military fire training areas | AFFF-certified airports | WWTPsc |
|---|
| PFBS | | | | |
| <90 ng/L (n = 1587) | 0.01 | 0.15 | 0.29 | 4.9 |
| >90 ng/L (n = 14) | 0.21 | 0.71 | 0.50 | 14.6 |
| p-valued | 0.206 | 0.105 | 0.148 | 0.069 |
| PFHxS | | | | |
| <30 ng/L (n = 1507) | 0.01 | 0.13 | 0.27 | 4.8 |
| >30 ng/L (n = 94) | 0.06 | 0.60 | 0.63 | 8.8 |
| p-value | 0.056 | <0.001 | <0.001 | <0.001 |
| PFHpA | | | | |
| <10 ng/L (n = 1509) | 0.01 | 0.13 | 0.26 | 4.7 |
| >10 ng/L (n = 92) | 0.09 | 0.57 | 0.67 | 9.7 |
| p-value | 0.016 | <0.001 | <0.001 | <0.001 |
| PFOA | | | | |
| <20 ng/L (n = 1473) | 0.01 | 0.13 | 0.26 | 4.6 |
| >20 ng/L (n = 128) | 0.05 | 0.52 | 0.56 | 9.5 |
| p-value | 0.038 | <0.001 | <0.001 | <0.001 |
| PFOS | | | | |
| <40 ng/L (n = 1487) | 0.01 | 0.13 | 0.26 | 4.7 |
| >40 ng/L (n = 114) | 0.05 | 0.54 | 0.57 | 8.9 |
| p-value | 0.064 | <0.001 | <0.001 | <0.001 |
| PFNA | | | | |
| <20 ng/L (n = 1586) | 0.01 | 0.15 | 0.28 | 4.9 |
| >20 ng/L (n = 15) | 0.13 | 1.13 | 1.13 | 20.1 |
| p-value | 0.366 | 0.014 | 0.008 | 0.007 |
Results of the Spatial Regression Model
Spatial regression modeling explains 38–62% of the variance in drinking water concentrations for the four PFASs considered (Table 2). Each additional industrial site within a HUC is associated with an 81% increase in PFOA (p
< 0.001), which is the strongest statistical association across
compounds and point sources. Increasing PFOS concentrations are
positively associated with the number of industrial sites, but this
relationship is not statistically significant (p = 0.124). The
small number of sites that have manufactured or used PFOS likely
accounts for the lack of a statistically significant relationship.
| compound | major industrial sitesa | MFTAsb | AFFF-certified airports | WWTPsc | λd | R2 |
|---|
| PFHxS | | | | | | |
| coefficiente | 24% | 20% | –13% | 1% | 94% | 0.62 |
| p-valuef | 0.249 | 0.002 | 0.073 | 0.045 | <0.001 | |
| PFHpA | | | | | | |
| coefficient | 10% | 10% | –2% | 0.5% | 72% | 0.40 |
| p-value | 0.569 | 0.155 | 0.761 | 0.436 | <0.001 | |
| PFOA | | | | | | |
| coefficient | 81% | 10% | –6% | 2% | 52% | 0.38 |
| p-value | <0.001 | 0.111 | 0.353 | 0.006 | <0.001 | |
| PFOS | | | | | | |
| coefficient | 46% | 35% | –6% | 2% | 79% | 0.46 |
| p-value | 0.124 | <0.001 | 0.512 | 0.007 | <0.001 | |
The number of
military fire training areas within each HUC is positively associated
with increasing levels of all PFOS, PFOA, PFHxS, and PFHpA, and is
statistically significant for PFHxS (p = 0.045) and PFOS (p = 0.007). Each additional military fire training area within the same HUC is associated with a 20% increase in PFHxS (p = 0.002), a 10% increase in PFHpA (p = 0.155), a 10% increase in PFOA (p = 0.111), and a 35% increase in PFOS (p
< 0.001). AFFFs typically contain relatively high concentrations of
PFOS and PFHxS and their polyfluorinated precursors compared to the
concentrations of other perfluorinated carboxylates,(23, 52-54) which is consistent with these statistical results.
We find a small but significant increase in PFOS and PFOA (2%; p
< 0.01) with each additional WWTP within the same HUC. This is
consistent with the greater abundance but smaller quantities of PFASs
released by WWTPs.(55) Similarly, results of Valsecchi et al.(51)
show PFAS releases from WWTPs are important but less significant than
those from fluorochemical manufacturing facilities in Italy. The number
of WWTPs may also be a proxy for other population-driven PFAS sources.
The
number of AFFF-certified airports is not significantly associated with
PFAS concentrations in the current data set. This may reflect
misclassification bias because the certification used to identify
airports indicates eligibility but not actual use of AFFF. The UCMR3
database contains limited data for smaller drinking water systems where
localized reports of contamination from airports have been most
abundant.(22, 56)
Current Data Limitations and Future Monitoring Efforts
The
UCMR3 database has several limitations that restrict its predictive
power for identifying U.S. drinking water supplies likely to contain
elevated levels of PFASs. Classification of geospatial data on intakes
for public water supplies limits the spatial resolution of the current
data set and associated statistical models to a radius of 50 km (median
radius of watersheds).(57, 58)
Many of the impacted drinking water systems are groundwater systems,
and contaminated groundwater plumes are often much smaller than 50 km.(23, 53, 59)
Geospatial
data are lacking for many potentially important PFAS point sources such
as a wide range of industries, landfills, biosolids application, and
other AFFF-impacted sites where relatively smaller volumes of AFFF were
released.(27, 54, 60-67)
Data on PFAS releases from smaller industrial facilities (e.g.,
plastics, textiles, paper, and lubricants) are usually withheld as
confidential business information, and little information about airborne
emissions is available for characterizing the importance of atmospheric
releases and potential long-range transport. For example, biosolids
application resulted in one of the largest PFAS drinking water
contamination events in Europe(68) but could not be included in this analysis because U.S. use data are not available on a national scale.
Sources not included in our spatial analysis are represented by the highly significant lambda (λ) coefficients (Table 2).
Areas with high model residuals (greater than 1.5 standard deviation)
mean that current information about sources cannot fully explain the
high observed PFAS concentrations. The map of model residuals (Figure S3) can thus be used to guide high-priority sampling regions in future work.
We
found a statistically greater abundance of point sources in watersheds
with detectable PFASs, including AFFF-certified airports. However,
multivariate spatial regression models did not show a significant
association between AFFF-certified airports and concentrations of PFASs
in nearby drinking water. Other studies have reported elevated PFAS
concentrations in groundwater wells adjacent to AFFF-certified airports.(22)
Small drinking water systems and private wells may be
disproportionately affected by PFASs originating from AFFF use at
civilian airports, but representative data for these small drinking
water systems are not included in the UCMR3 program.(69)
Approximately 44.5 million U.S. individuals rely on private drinking water wells,(70)
and 52 million individuals rely on smaller public water supplies
(<10000 served). The UCMR3 program includes 0.5% testing incidence
for smaller public water supplies(71)
and no testing of private wells, meaning that information about
drinking water PFAS exposures is therefore lacking for almost one-third
of the U.S. population.
The authors declare no competing financial interest.
Acknowledgment
We
acknowledge financial support for research at Harvard from the Smith
Family Foundation and a private donor. We thank Marcia Castro (Harvard)
for her feedback on an earlier version of the manuscript and Jahred
Liddie (Harvard) for his assistance with the sensitivity analysis.
T.A.B. was supported by the U.S. National Institute for Environmental
Health Sciences (NIEHS) Superfund Research Program (Grant P42 ES004705)
and the Superfund Research Center at the University of California,
Berkeley. The views expressed in this article are those of the authors
and do not necessarily represent the views or policies of the U.S.
Environmental Protection Agency.
References
This article references 71 other publications.
1.
Kissa, E. Fluorinated surfactants and repellents, 2nd ed.; CRC Press: Boca Raton, FL, 2001.
2.
Lewis, R. C.; Johns, L. E.; Meeker, J. D.Serum
Biomarkers of Exposure to Perfluoroalkyl Substances in Relation to
Serum Testosterone and Measures of Thyroid Function among Adults and
Adolescents from NHANES 2011–2012 Int. J. Environ. Res. Public Health 2015, 12 ( 6) 6098– 6114, DOI: 10.3390/ijerph120606098
3.
Fourth National Report on Human Exposure to Environmental Chemicals; Centers for Disease Control and Prevention: Atlanta, 2015.
4.
Grandjean, P.; Andersen, E.; Budtz-Jørgensen, E.; Nielsen, F.; Mølbak, K.; Weihe, P.; Heilmann, C.Serum vaccine antibody concentrations in children exposed to perfluorinated compounds JAMA 2012, 307 ( 4) 391– 397, DOI: 10.1001/jama.2011.2034
5.
Braun, J. M.; Chen, A.; Romano, M. E.; Calafat, A. M.; Webster, G. M.; Yolton, K.; Lanphear, B. P.Prenatal perfluoroalkyl substance exposure and child adiposity at 8 years of age: The HOME study Obesity 2016, 24, 231– 237, DOI: 10.1002/oby.21258
6.
Barry, V.; Winquist, A.; Steenland, K.Perfluorooctanoic acid (PFOA) exposures and incident cancers among adults living near a chemical plant Environ. Health Perspect 2013, 121 ( 11–12) 1313– 1318, DOI: 10.1289/ehp.1306615
7.
Land, M.; de Wit, C. A.; Cousins, I. T.; Herzke, D.; Johansson, J.; Martin, J. W.What
is the effect of phasing out long-chain per- and polyfluoroalkyl
substances on the concentrations of perfluoroalkyl acids and their
precursors in the environment? A systematic review protocol Environmental Evidence 2015, 4 ( 1) 1– 13, DOI: 10.1186/2047-2382-4-3
8.
Working Towards a Global Emission Inventory of PFASs; Environment Directorate, Organization for Economic Cooperation and Development: Paris, 2015.
9.
Wang, Z.; Cousins, I. T.; Scheringer, M.; Buck, R. C.; Hungerbühler, K.Global
emission inventories for C 4–C 14 perfluoroalkyl carboxylic acid (PFCA)
homologues from 1951 to 2030, Part I: production and emissions from
quantifiable sources Environ. Int. 2014, 70, 62– 75, DOI: 10.1016/j.envint.2014.04.013
10.
Butenhoff, J. L.; Chang, S.-C.; Ehresman, D. J.; York, R. G.Evaluation of potential reproductive and developmental toxicity of potassium perfluorohexanesulfonate in Sprague Dawley rats Reprod. Toxicol. 2009, 27 ( 3) 331– 341, DOI: 10.1016/j.reprotox.2009.01.004
11.
Birnbaum, L. S.; Grandjean, P.Alternatives to PFASs: Perspectives on the Science Environ. Health Perspect. 2015, 123 ( 5) A104, DOI: 10.1289/ehp.1509944
12.
Caverly Rae, J. M.; Craig, L.; Slone, T. W.; Frame, S. R.; Buxton, L. W.; Kennedy, G. L.Evaluation
of chronic toxicity and carcinogenicity of ammonium
2,3,3,3-tetrafluoro-2-(heptafluoropropoxy)-propanoate in Sprague–Dawley
rats Toxicology Reports 2015, 2, 939– 949, DOI: 10.1016/j.toxrep.2015.06.001
13.
Vestergren, R.; Cousins, I. T.Tracking the Pathways of Human Exposure to Perfluorocarboxylates Environ. Sci. Technol. 2009, 43 ( 15) 5565– 5575, DOI: 10.1021/es900228k
14.
D’Hollander, W.; de Voogt, P.; De Coen, W.; Bervoets, L. Perfluorinated Substances in Human Food and Other Sources of Human Exposure. In Reviews of Environmental Contamination and Toxicology; De Voogt, P., Ed.; Springer: New York, 2010; Vol. 208, pp 179– 215.
15.
Emmett, E. A.; Shofer, F. S.; Zhang, H.; Freeman, D.; Desai, C.; Shaw, L. M.Community exposure to perfluorooctanoate: relationships between serum concentrations and exposure sources J. Occup. Environ. Med. 2006, 48 ( 8) 759– 770, DOI: 10.1097/01.jom.0000232486.07658.74
16.
Landsteiner, A.; Huset, C.; Williams, A.; Johnson, J.Biomonitoring for Perfluorochemicals in a Minnesota Community With Known Drinking Water Contamination Journal of Environmental Health 2014, 77 ( 5) 14– 19
17.
Hurley, S.; Houtz, E.; Goldberg, D.; Wang, M.; Park, J.-S.; Nelson, D. O.; Reynolds, P.; Bernstein, L.; Anton-Culver, H.; Horn-Ross, P.; Petreas, M.Preliminary
Associations between the Detection of Perfluoroalkyl Acids (PFAAs) in
Drinking Water and Serum Concentrations in a Sample of California Women Environ. Sci. Technol. Lett. 2016, 3, 264– 269, DOI: 10.1021/acs.estlett.6b00154
18.
Hoffman, K.; Webster, T. F.; Bartell, S. M.; Weisskopf, M. G.; Fletcher, T.; Vieira, V. M.Private
Drinking Water Wells as a Source of Exposure to Perfluorooctanoic Acid
(PFOA) in Communities Surrounding a Fluoropolymer Production Facility Environ. Health Perspect. 2011, 119, 92– 97, DOI: 10.1289/ehp.1002503
19.
Shin, H.-M.; Vieira, V. M.; Ryan, P. B.; Detwiler, R.; Sanders, B.; Steenland, K.; Bartell, S. M.Environmental Fate and Transport Modeling for Perfluorooctanoic Acid Emitted from the Washington Works Facility in West Virginia Environ. Sci. Technol. 2011, 45 ( 4) 1435– 1442, DOI: 10.1021/es102769t
20.
Perfluorochemical Serum Sampling in the vicinity of Decatur, Alabama, Morgan, Lawrence, and Limestone Counties; Centers for Disease Control and Prevention: Atlanta, 2013.
21.
Lifetime Health Advisories and Health Effects Support Documents for Perfluorooctanoic Acid and Perfluorooctane Sulfonate; Environmental Protection Agency: Washington, DC, 2016.
22.
Ahrens, L.; Norstrom, K.; Viktor, T.; Cousins, A. P.; Josefsson, S.Stockholm Arlanda Airport as a source of per- and polyfluoroalkyl substances to water, sediment and fish Chemosphere 2015, 129, 33– 8, DOI: 10.1016/j.chemosphere.2014.03.136
23.
Moody, C. A.; Hebert, G. N.; Strauss, S. H.; Field, J. A.Occurrence
and persistence of perfluorooctanesulfonate and other perfluorinated
surfactants in groundwater at a fire-training area at Wurtsmith Air
Force Base, Michigan, USA J. Environ. Monit. 2003, 5 ( 2) 341– 5, DOI: 10.1039/b212497a
24.
Schultz, M. M.; Higgins, C. P.; Huset, C. A.; Luthy, R. G.; Barofsky, D. F.; Field, J. A.Fluorochemical mass flows in a municipal wastewater treatment facility Environ. Sci. Technol. 2006, 40 ( 23) 7350– 7357, DOI: 10.1021/es061025m
25.
Loganathan, B. G.; Sajwan, K. S.; Sinclair, E.; Senthil Kumar, K.; Kannan, K.Perfluoroalkyl sulfonates and perfluorocarboxylates in two wastewater treatment facilities in Kentucky and Georgia Water Res. 2007, 41 ( 20) 4611– 20, DOI: 10.1016/j.watres.2007.06.045
26.
Post, G. B.; Cohn, P. D.; Cooper, K. R.Perfluorooctanoic acid (PFOA), an emerging drinking water contaminant: a critical review of recent literature Environ. Res. 2012, 116, 93– 117, DOI: 10.1016/j.envres.2012.03.007
27.
Lindstrom, A. B.; Strynar, M. J.; Delinsky, A. D.; Nakayama, S. F.; McMillan, L.; Libelo, E. L.; Neill, M.; Thomas, L.Application
of WWTP biosolids and resulting perfluorinated compound contamination
of surface and well water in Decatur, Alabama, USA Environ. Sci. Technol. 2011, 45 ( 19) 8015– 8021, DOI: 10.1021/es1039425
-
-
-
-
-
-
34.
Programs
for Training of Aircraft Rescue and Firefighting Personnel; U.S.
Department of Transportation Federal Aviation Administration, AC No.
150/5210-17C, 2015.
35.
3M. Map, 3M-Decatur Manufacturing Facility. In U.S. EPA Docket AR226-1484; Environmental Protection Agency: Washington, DC, 2003.
36.
DuPont. DuPont Telomer Manufacturing Sites: Environmental Assessment of PFOA Levels in Air and Water. In U.S. EPA Docket AR226-1534; Environmental Protection Agency: Washington, DC, 2003.
37.
Akaike, H.A new look at the statistical model identification IEEE Trans. Autom. Control 1974, 19 ( 6) 716– 723, DOI: 10.1109/TAC.1974.1100705
38.
Anselin, L.; Syabri, I.; Kho, Y.GeoDa: an introduction to spatial data analysis Geographical analysis 2006, 38 ( 1) 5– 22, DOI: 10.1111/j.0016-7363.2005.00671.x
-
-
41.
EU.
Directive 2013/39/EUof the European Parliament andof the Council of 12
August 2013 amending Directives 2000/60/EC and2008/105/EC as regards
priority substances in the field of water policy.In EU Environmental Quality Standards; 2013.
-
43.
Buck, R. C.; Franklin, J.; Berger, U.; Conder, J. M.; Cousins, I. T.; de Voogt, P.; Jensen, A. A.; Kannan, K.; Mabury, S. A.; van Leeuwen, S. P. J.Perfluoroalkyl and Polyfluoroalkyl Substances in the Environment: Terminology, Classification, and Origins Integr. Environ. Assess. Manage. 2011, 7 ( 4) 513– 541, DOI: 10.1002/ieam.258
44.
Bergström, S. Transport of per-and polyfluoroalkyl substances in soil and groundwater in Uppsala, Sweden. 2014.
45.
Thompson, J.; Eaglesham, G.; Mueller, J.Concentrations of PFOS, PFOA and other perfluorinated alkyl acids in Australian drinking water Chemosphere 2011, 83 ( 10) 1320– 1325, DOI: 10.1016/j.chemosphere.2011.04.017
46.
Taniyasu, S.; Kannan, K.; Wu, Q.; Kwok, K. Y.; Yeung, L. W. Y.; Lam, P. K. S.; Chittim, B.; Kida, T.; Takasuga, T.; Tsuchiya, Y.; Yamashita, N.Inter-laboratory
trials for analysis of perfluorooctanesulfonate and perfluorooctanoate
in water samples: Performance and recommendations Anal. Chim. Acta 2013, 770, 111– 120, DOI: 10.1016/j.aca.2013.01.056
47.
Eriksson, U.; Kärrman, A.; Rotander, A.; Mikkelsen, B.; Dam, M.Perfluoroalkyl substances (PFASs) in food and water from Faroe Islands Environ. Sci. Pollut. Res. 2013, 20 ( 11) 7940– 7948, DOI: 10.1007/s11356-013-1700-3
48.
Happonen, M.; Koivusalo, H.; Malve, O.; Perkola, N.; Juntunen, J.; Huttula, T.Contamination risk of raw drinking water caused by PFOA sources along a river reach in south-western Finland Sci. Total Environ. 2016, 541, 74– 82, DOI: 10.1016/j.scitotenv.2015.09.008
49.
Munoz, G.; Vo Duy, S.; Budzinski, H.; Labadie, P.; Liu, J.; Sauvé, S.Quantitative
analysis of poly- and perfluoroalkyl compounds in water matrices using
high resolution mass spectrometry: Optimization for a laser diode
thermal desorption method Anal. Chim. Acta 2015, 881, 98– 106, DOI: 10.1016/j.aca.2015.04.015
50.
Grandjean, P.; Budtz-Jorgensen, E.Immunotoxicity of perfluorinated alkylates: calculation of benchmark doses based on serum concentrations in children Environ. Health 2013, 12 ( 1) 35, DOI: 10.1186/1476-069X-12-35
51.
Valsecchi, S.; Rusconi, M.; Mazzoni, M.; Viviano, G.; Pagnotta, R.; Zaghi, C.; Serrini, G.; Polesello, S.Occurrence and sources of perfluoroalkyl acids in Italian river basins Chemosphere 2015, 129, 126– 134, DOI: 10.1016/j.chemosphere.2014.07.044
52.
Hebert, G. N.; Odom, M. A.; Craig, P. S.; Dick, D. L.; Strauss, S. H.Method for the determination of sub-ppm concentrations of perfluoroalkylsulfonate anions in water J. Environ. Monit. 2002, 4 ( 1) 90– 95, DOI: 10.1039/b108463c
53.
Houtz, E. F.; Higgins, C. P.; Field, J. A.; Sedlak, D. L.Persistence of perfluoroalkyl acid precursors in AFFF-impacted groundwater and soil Environ. Sci. Technol. 2013, 47 ( 15) 8187– 8195, DOI: 10.1021/es4018877
54.
Anderson, R. H.; Long, G. C.; Porter, R. C.; Anderson, J. K.Occurrence
of select perfluoroalkyl substances at U.S. Air Force aqueous
film-forming foam release sites other than fire-training areas:
Field-validation of critical fate and transport properties Chemosphere 2016, 150, 678– 85, DOI: 10.1016/j.chemosphere.2016.01.014
55.
Sinclair, E.; Kannan, K.Mass Loading and Fate of Perfluoroalkyl Surfactants in Wastewater Treatment Plants Environ. Sci. Technol. 2006, 40 ( 5) 1408– 1414, DOI: 10.1021/es051798v
56.
Schaider, L. A.; Rudel, R. A.; Ackerman, J. M.; Dunagan, S. C.; Brody, J. G.Pharmaceuticals,
perfluorosurfactants, and other organic wastewater compounds in public
drinking water wells in a shallow sand and gravel aquifer Sci. Total Environ. 2014, 468–469, 384– 393, DOI: 10.1016/j.scitotenv.2013.08.067
57.
Pascual, P.; Stiber, N.; Sunderland, E. Draft guidance on the development, evaluation, and application of regulatory environmental models; The
Council for Regulatory Environmental Modeling, Office of Science
Policy, Office of Research and Development, Environmental Protection
Agency: Washington, DC, 2003.
58.
NRC. Models in Environmental Regulatory Decision Making; National Research Council, Committee on Models in the Regulatory Decision Process, National Academies Press: Washington, DC, 2007.
59.
Houtz, E. F.; Sutton, R.; Park, J.-S.; Sedlak, M.Poly-
and perfluoroalkyl substances in wastewater: Significance of unknown
precursors, manufacturing shifts, and likely AFFF impacts Water Res. 2016, 95, 142– 149, DOI: 10.1016/j.watres.2016.02.055
60.
Konwick, B. J.; Tomy, G. T.; Ismail, N.; Peterson, J. T.; Fauver, R. J.; Higginbotham, D.; Fisk, A. T.Concentrations and patterns of perfluoroalkyl acids in Georgia, USA surface waters near and distant to a major use source Environ. Toxicol. Chem. 2008, 27 ( 10) 2011– 2018, DOI: 10.1897/07-659.1
61.
Clara, M.; Scheffknecht, C.; Scharf, S.; Weiss, S.; Gans, O.Emissions of perfluorinated alkylated substances (PFAS) from point sources--identification of relevant branches Water Sci. Technol. 2008, 58 ( 1) 59, DOI: 10.2166/wst.2008.641
62.
Zhang, C.; Peng, Y.; Niu, X.; Ning, K.Determination of perfluoroalkyl substances in municipal landfill leachates from Beijing, China Asian J. Chem. 2014, 26 ( 13) 3833
63.
Busch, J.; Ahrens, L.; Sturm, R.; Ebinghaus, R.Polyfluoroalkyl compounds in landfill leachates Environ. Pollut. 2010, 158 ( 5) 1467– 1471, DOI: 10.1016/j.envpol.2009.12.031
64.
Huset, C. A.; Barlaz, M. A.; Barofsky, D. F.; Field, J. A.Quantitative determination of fluorochemicals in municipal landfill leachates Chemosphere 2011, 82 ( 10) 1380– 1386, DOI: 10.1016/j.chemosphere.2010.11.072
65.
Blaine, A. C.; Rich, C. D.; Hundal, L. S.; Lau, C.; Mills, M. A.; Harris, K. M.; Higgins, C. P.Uptake of perfluoroalkyl acids into edible crops via land applied biosolids: Field and greenhouse studies Environ. Sci. Technol. 2013, 47 ( 24) 14062– 14069, DOI: 10.1021/es403094q
66.
Sepulvado, J. G.; Blaine, A. C.; Hundal, L. S.; Higgins, C. P.Occurrence and fate of perfluorochemicals in soil following the land application of municipal biosolids Environ. Sci. Technol. 2011, 45 ( 19) 8106– 8112, DOI: 10.1021/es103903d
67.
Rich, C. D.; Blaine, A. C.; Hundal, L.; Higgins, C. P.Bioaccumulation of perfluoroalkyl acids by earthworms (Eisenia fetida) exposed to contaminated soils Environ. Sci. Technol. 2015, 49 ( 2) 881– 8, DOI: 10.1021/es504152d
68.
Hölzer, J.; Midasch, O.; Rauchfuss, K.; Kraft, M.; Reupert, R.; Angerer, J.; Kleeschulte, P.; Marschall, N.; Wilhelm, M.Biomonitoring of Perfluorinated Compounds in Children and Adults Exposed to Perfluorooctanoate-Contaminated Drinking Water Environ. Health Perspect. 2008, 116 ( 5) 651– 657, DOI: 10.1289/ehp.11064
69.
Report of Investigation Activities at Select Firefighting Foam Training Areas and Foam Discharge Sites in Minnesota; Minnesota Pollution Control Agency: St. Paul, MN, 2010.
70.
Maupin, M. A.; Kenny, J. F.; Hutson, S. S.; Lovelace, J. K.; Barber, N. L.; Linsey, K. S. Estimated use of water in the United States in 2010. Report 2330-5703; U.S. Geological Survey, 2014.
71.
Factoids: Drinking Water and Ground Water Statistics for 2009; Environmental Protection Agency Office of Water: Washington, DC, 2009.
===================


 MILWAUKEE, Wisc. – Following an incident in Frankfort, Mich., Sunday morning, the Coast Guard is urging the public to stay off breakwalls, jetties and low piers as hazardous weather passes through the area.