Seasonal Low in Arctic Sea Ice Reached
By MarEx 2016-09-15 21:22:51
The Arctic’s ice cover appears to have reached its minimum extent on September 10, 2016, according to scientists at the U.S. National Snow and Ice Data Center (NSIDC).
Arctic sea ice extent on that day stood at 4.14 million square kilometers (1.60 million square miles), statistically tied at second lowest in the satellite record with the 2007 minimum. The 2007 minimum occurred on September 18 of that year when Arctic sea ice extent stood at 4.15 million square kilometers (1.60 million square miles).
Arctic sea ice cover grows each autumn and winter and shrinks each spring and summer. Each year, Arctic sea ice reaches its minimum extent in September. The record lowest extent in the 37-year satellite record occurred on September 17, 2012, when sea ice extent fell to 3.39 million square kilometers (1.31 million square miles).
“It was a stormy, cloudy, and fairly cool summer,” said NSIDC director Mark Serreze. “Historically, such weather conditions slow down the summer ice loss, but we still got down to essentially a tie for second lowest in the satellite record.”
During the first ten days of September this year, the Arctic lost ice at a faster than average rate. On average, the Arctic lost 34,100 square kilometers (13,200 square miles) per day compared to the 1981 to 2010 long-term average of 21,000 square kilometers (8,100 square miles) per day.
The early September rate of decline also greatly exceeded the rate observed for the same period during the record low year of 2012 (19,000 square kilometers, or 7,340 square miles, per day). By September, the air is cooling and there is little surface melt. This argues that that the fairly rapid early September ice loss was due to extra heat in the upper ocean. Recent ice loss was most pronounced in the Chukchi Sea, northwest of Alaska.
NSIDC scientists said ice may also relate to the impact of two strong storms that passed through the region during August. The scientists said there was a lot of thin ice at the beginning of the melt season. Because thinner ice does not take as much energy to melt away, this may have also contributed to this year’s low minimum extent.
More information is available here.
========
2016 ties with 2007 for second lowest Arctic sea ice minimum
September 15, 2016
Arctic sea ice appears to have reached its seasonal minimum extent for 2016 on September 10. A relatively rapid loss of sea ice in the first ten days of September has pushed the ice extent to a statistical tie with 2007 for the second lowest in the satellite record. September’s low extent followed a summer characterized by conditions generally unfavorable for sea ice loss.
Please note that this is a preliminary announcement. Changing winds or late-season melt could still reduce the Arctic ice extent, as happened in 2005 and 2010. NSIDC scientists will release a full analysis of the Arctic melt season, and discuss the Antarctic winter sea ice growth, in early October.
Overview of conditions

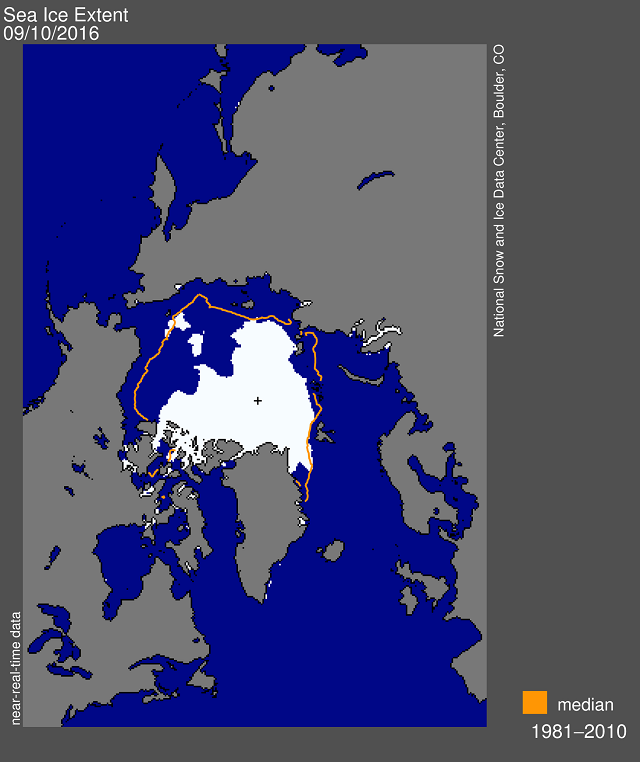
Figure 1. Arctic sea ice extent for September 10, 2016 was 4.14 million square kilometers (1.60 million square miles). The orange line shows the 1981 to 2010 median extent for that day. The black cross indicates the geographic North Pole. Sea Ice Index data. About the data
Credit: National Snow and Ice Data Center
On September 10, Arctic sea ice extent stood at 4.14 million square kilometers (1.60 million square miles). This appears to have been the lowest extent of the year and is tied with 2007 as the second lowest extent on record. This year’s minimum extent is 750,000 square kilometers (290,000 square miles) above the record low set in 2012 and is well below the two standard deviation range for the 37-year satellite record. Satellite data show extensive areas of open water in the Beaufort and Chukchi seas, and in the Laptev and East Siberian seas.
During the first ten days of September, the Arctic lost ice at a faster than average rate. Ice extent lost 34,100 square kilometers (13,200 square miles) per day compared to the 1981 to 2010 long-term average of 21,000 square kilometers (8,100 square miles) per day. The early September rate of decline also greatly exceeded the rate observed for the same period in 2012 (19,000 square kilometers, or 7,340 square miles, per day). Recent ice loss has been most pronounced in the Chukchi Sea. This may relate to the impact of two strong cyclones that passed through the region during August.
Satellite passive microwave data and images from the Moderate Resolution Imaging Spectroradiometer (MODIS) suggest that the southern Northwest Passage routes are still open. While the passive microwave data show that the Northern Sea route is open, MODIS data reveal a narrow band of scattered sea ice blocking the passage near the Taymyr Peninsula.
Conditions in context
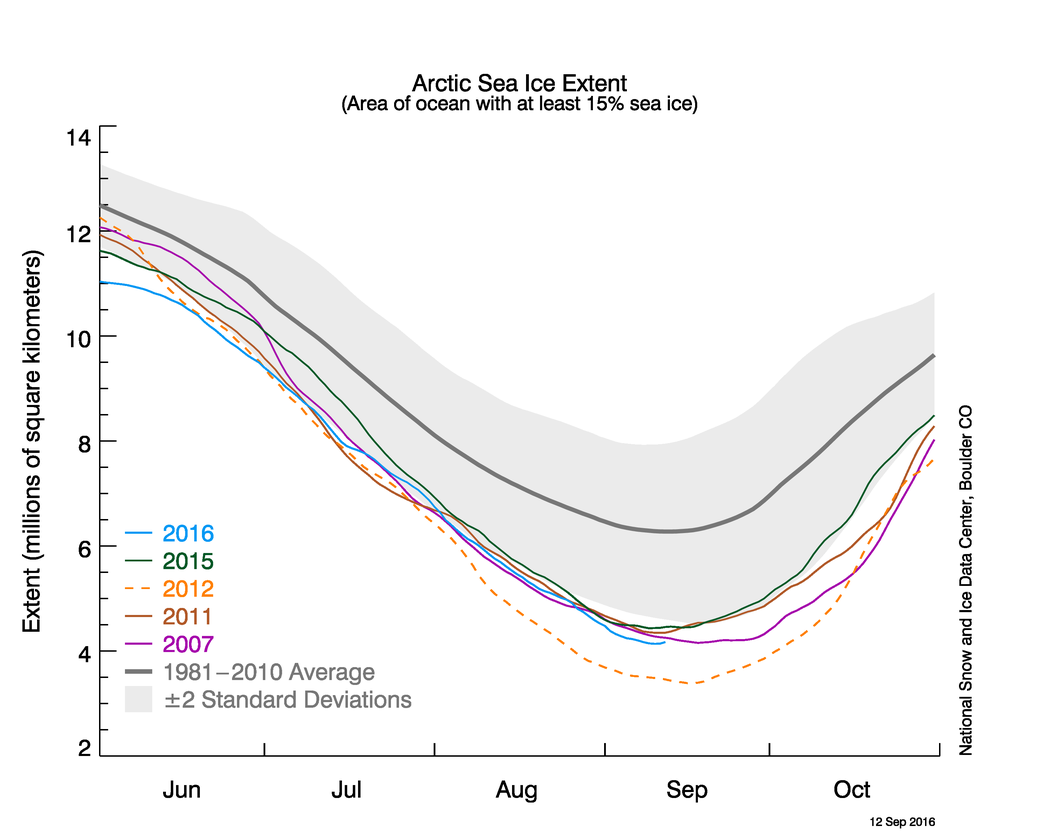
Figure 2a. The graph shows Arctic sea ice extent as of September 12, 2016, along with daily ice extent data for four other record low years. 2016 is shown in blue, 2015 in green, 2012 in orange, 2011 in brown, and 2007 in purple. The 1981 to 2010 average is in dark gray. The gray area around the average line shows the two standard deviation range of the data. Sea Ice Index data.
Credit: National Snow and Ice Data Center
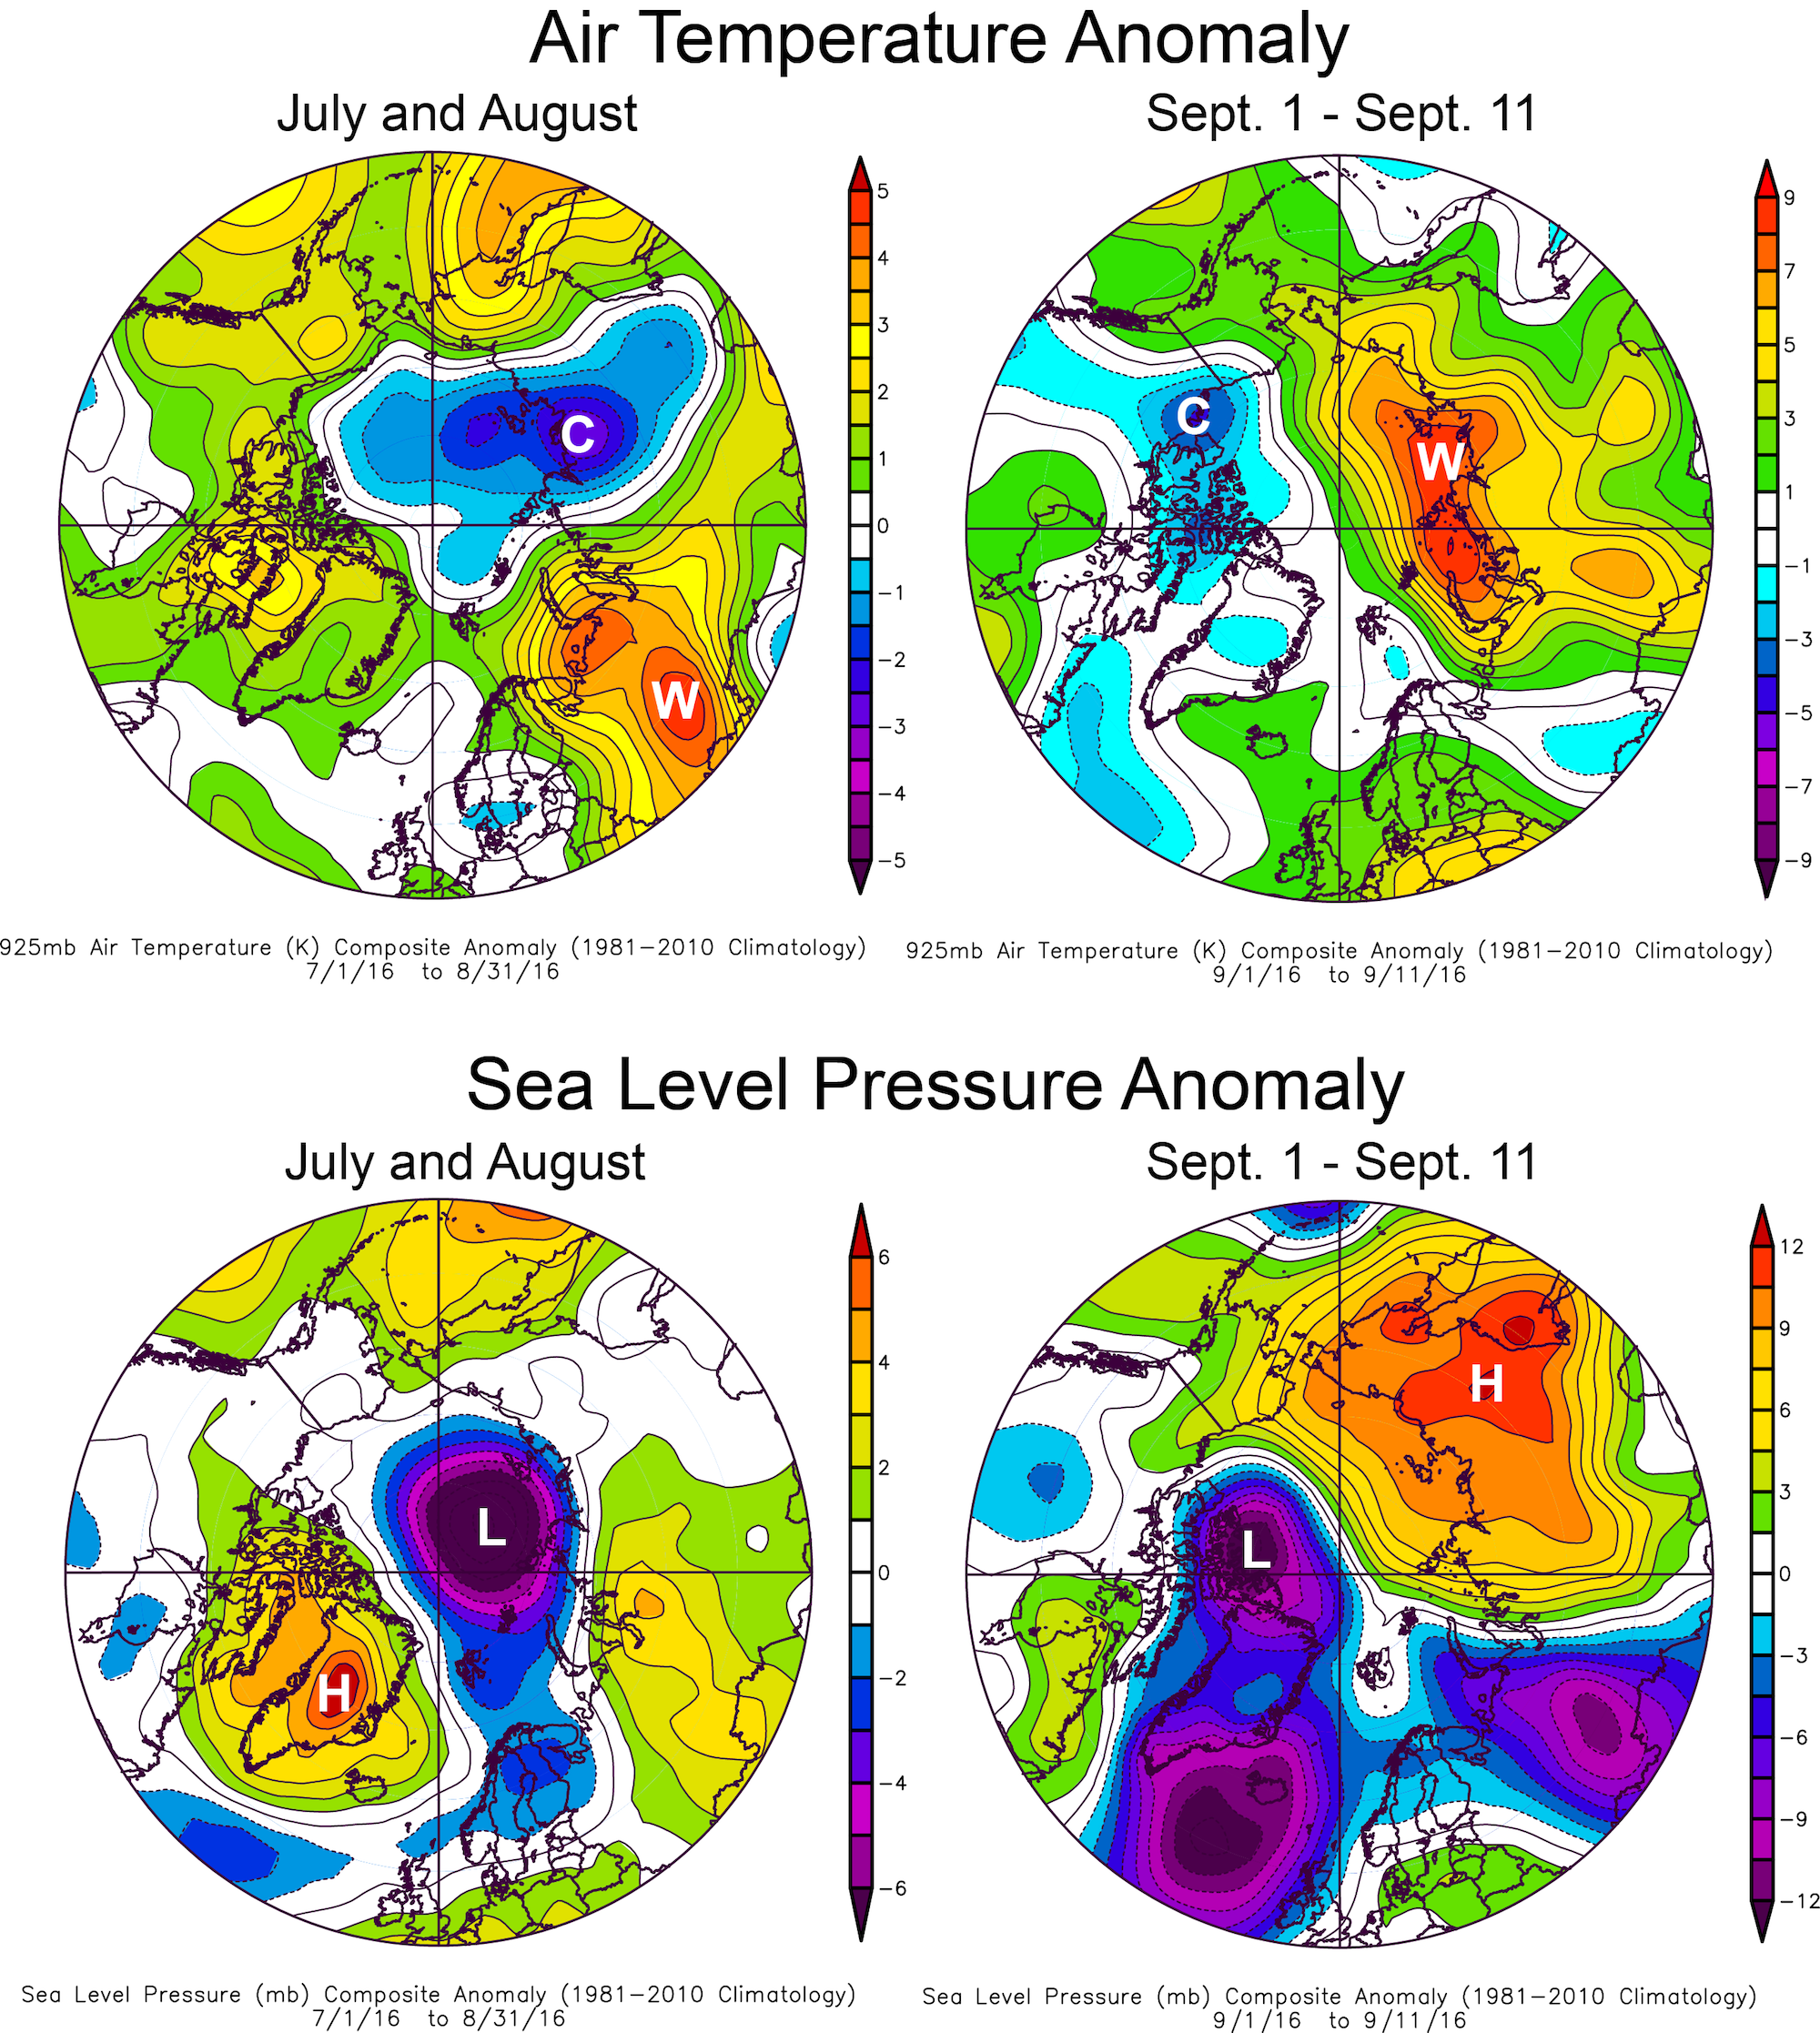
Figure 2b. This plot shows Arctic air temperature anomalies at the 925 hPa level in degrees Celsius and sea level pressure anomalies for two periods: July 1 to August 31, and September 1 through September 11. Yellows and reds indicate higher than average temperatures and pressure; blues and purples indicate lower than average temperatures and pressure.
Credit: NSIDC courtesy NOAA Earth System Research Laboratory Physical Sciences Division
Weather in early September was warm along the Siberian coast (up to 9 degrees Celsius or 16 degrees Fahrenheit above average), with high pressure over the same region and strong winds across the central Arctic. However, as discussed in previous posts, weather over the Arctic Ocean this past summer has been generally stormy, cool, and cloudy—conditions that previous studies have shown to generally limit the rate of summer ice loss. That September ice extent nevertheless fell to second lowest in the satellite record is hence surprising. Averaged for July through August, air temperatures at the 925 hPa level (about 2,500 feet above sea level) were 0.5 to 2 degrees Celsius (1 to 4 degrees Fahrenheit) below the 1981 to 2010 long-term average over much of the central Arctic Ocean, and near average to slightly higher than average near the North American and easternmost Siberian coasts. Reflecting the stormy conditions, sea level pressures were much lower than average in the central Arctic during these months.
Why did extent fall to a tie for second lowest with 2007? The 2016 Arctic melt season started with a record low maximum extent in March, and sea ice was measured at record low monthly extents well into June. Computer models of ice thickness, and maps of sea ice age both indicated a much thinner ice pack at the end of winter. Statistically, there is little relationship between May and September sea ice extents after removing the long-term trend, indicating the strong role of summer weather patterns in controlling sea ice loss. However, the initial ice thickness may play a significant role. As noted in our mid-August post, the upper ocean was quite warm this summer and ocean-driven melting is important during late summer. The science community will be examining these issues in more detail in coming months.
Ice loss primarily in the northern Chukchi Sea
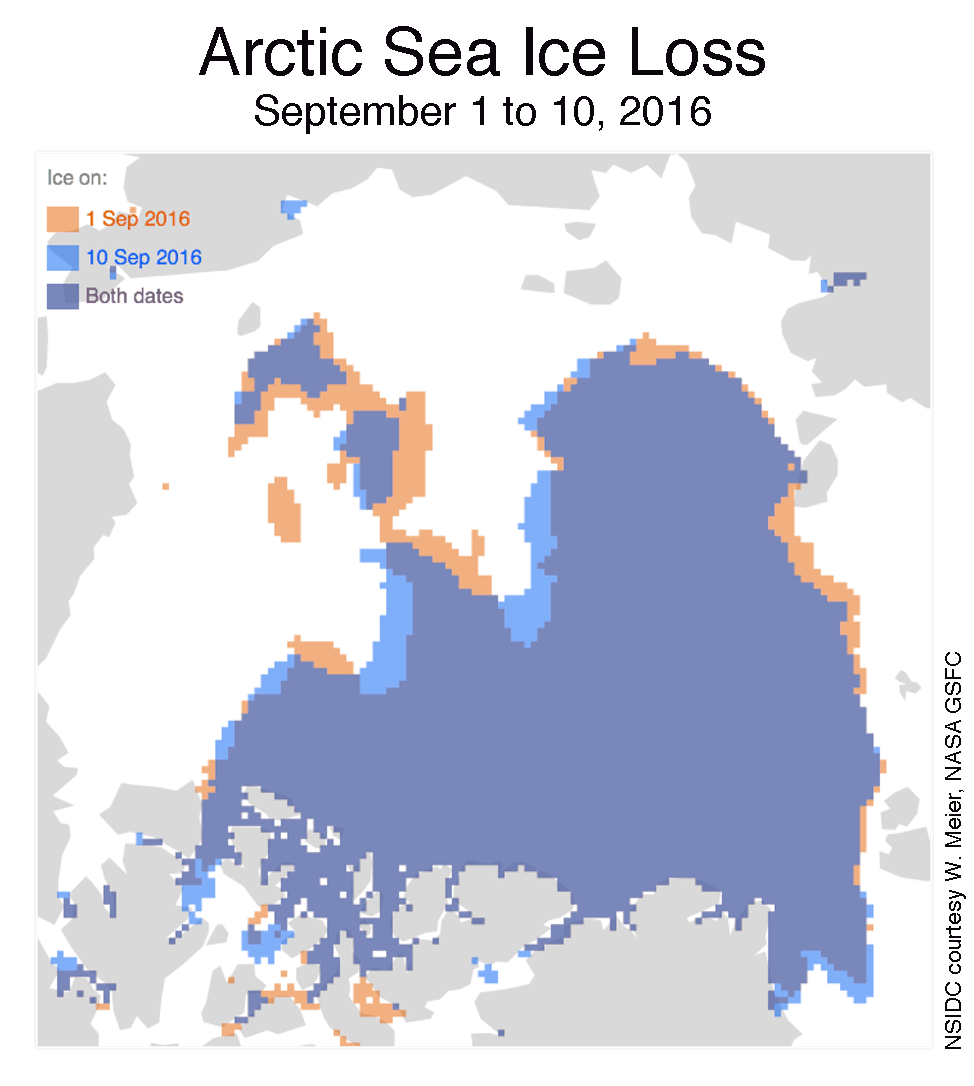
Figure 4. This figure compares Arctic sea ice extent for September 1 (orange) and September 10 (blue), with overlap areas in purple.
Credit: National Snow and Ice Data Center
The late season ice loss appears to have been greatest in an extended area of patchy ice reaching from the eastern Beaufort Sea to the northern Chukchi Sea. This is in the area influenced by the two strong cyclones discussed in our August posts—the strong winds appear to have compacted the ice cover and may have led to an upward mixing of warm ocean water.
Second opinion

Figure 5. This graph compares Arctic sea ice extent trends from August 15 to September 10 for the years 2007 (F-17), 2012 (F-17), and 2016 (F-17 and F-18). The NSIDC Sea Ice Index currently uses data from the F-18 satellite.
Credit: W. Meier, NASA GSFC, NSIDC
The Defense Meteorological Satellite Program (DMSP) F-17 satellite, which NSIDC ceased to use in May as its primary source for sea ice extent due to erratic data, has since re-stabilized and is providing more consistent day-to-day readings. While NSIDC will continue to use the DMSP F-18 satellite for data processing, it is instructive to examine the F-17 record. Early September extent from the F-17 record is slightly higher than from F-18. Both sensors indicate that the minimum extent for 2016 is slightly lower than the 2007 minimum, which was 4.15 million square kilometers (1.60 million square miles) and reached on September 18. However, the measurement accuracy is about ±25,000 square kilometers (±9,600 square miles) for a five-day trailing average daily extent measurement. This means that at the present levels, 2016 is a statistical tie for second lowest sea ice extent.
Note that the dates and extents of the minima have been re-calculated from what we posted in previous years. In June 2016, NSIDC transitioned to using data from the DMSP F-18 satellite, due to issues with the F-17 satellite. Data beginning April 1, 2016 are from F-18. In July 2016, Sea Ice Index data were updated to Version 2. These changes do not significantly affect sea ice trends and year-to-year comparisons, but in some instances users may notice small changes in values from the previous version of the data. Details on the changes are discussed in the Sea Ice Index documentation.