Traffic deaths in these 15 states setting pace for deadliest driving year since 2007
U.S. traffic deaths, injuries and property damage pacing 24% higher than 2014
Aug 26, 2015 | By Jayleen R. Heft, PropertyCasualty360.com

A head on collision between a tractor-trailer and an automobile carrying 3 Linden police officers and a civilian employee, killing two and leaving two others in critical condition. The car was traveling in the wrong direction on the southbound West Shore Expressway at about 5 a.m. when the crash occurred in Staten Island, New York City on March 20, 2015. Credit: Dennis Van Tine/MediaPunch/IPX
Despite high-tech safety features and the increasing ability of vehicles to protect occupants during a crash, the U.S. is having a deadly year on the nation's roads.
The National Safety Council (NSC) estimates traffic deaths are 14% higher through the first six months of 2015 than they were during the same period in 2014, and serious injuries are 30% higher than at the same time last year.
From January to June, nearly 19,000 people died in traffic crashes across the U.S., and more than 2.2 million were seriously injured, putting the country on pace for its deadliest driving year since 2007.
$152 billion impact
Costs also are up. The six-month estimated bill for traffic deaths, injuries and property damage is $152 billion—24% higher than 2014. The costs include wage and productivity losses, medical expenses, administrative expenses, employer costs and property damage.
"Follow the numbers: The trend we are seeing on our roadways is like a flashing red light–danger lies ahead," said Deborah A.P. Hersman, NSC's president and CEO. "Be a defensive driver and make safe decisions behind the wheel. Your life really depends on it."
What's to blame?
The high death and injury toll could be due to many factors; however, an improving economy with lower gas prices and unemployment rates have brought increases in vehicle miles traveled. According to the Energy Information Administration, average gas prices are 30% lower than they were in 2014 and are projected to remain relatively stable heading into 2016. This generally means an increase in traffic as more people can afford to drive, and many travel longer distances and take vacations.
Cellphone use may also be a culprit. An NSC study earlier this year indicated cellphone use is a factor in one quarter of all accidents.
Aggressive drivers, drunk drivers, speeding drivers, old drivers are also among the leading reasons of crashes.

(Photo: Chris Parypa Photography/Shutterstock.com)
4. Georgia (tie with Minnesota)
Traffic deaths up 26% over the first six months of 2014.
657 traffic deaths from January 1 through June 30, 2015.
3. Minnesota (tie with Georgia)
Traffic deaths up 26% over the first six months of 2014.
187 traffic deaths from January 1 through June 30, 2015.
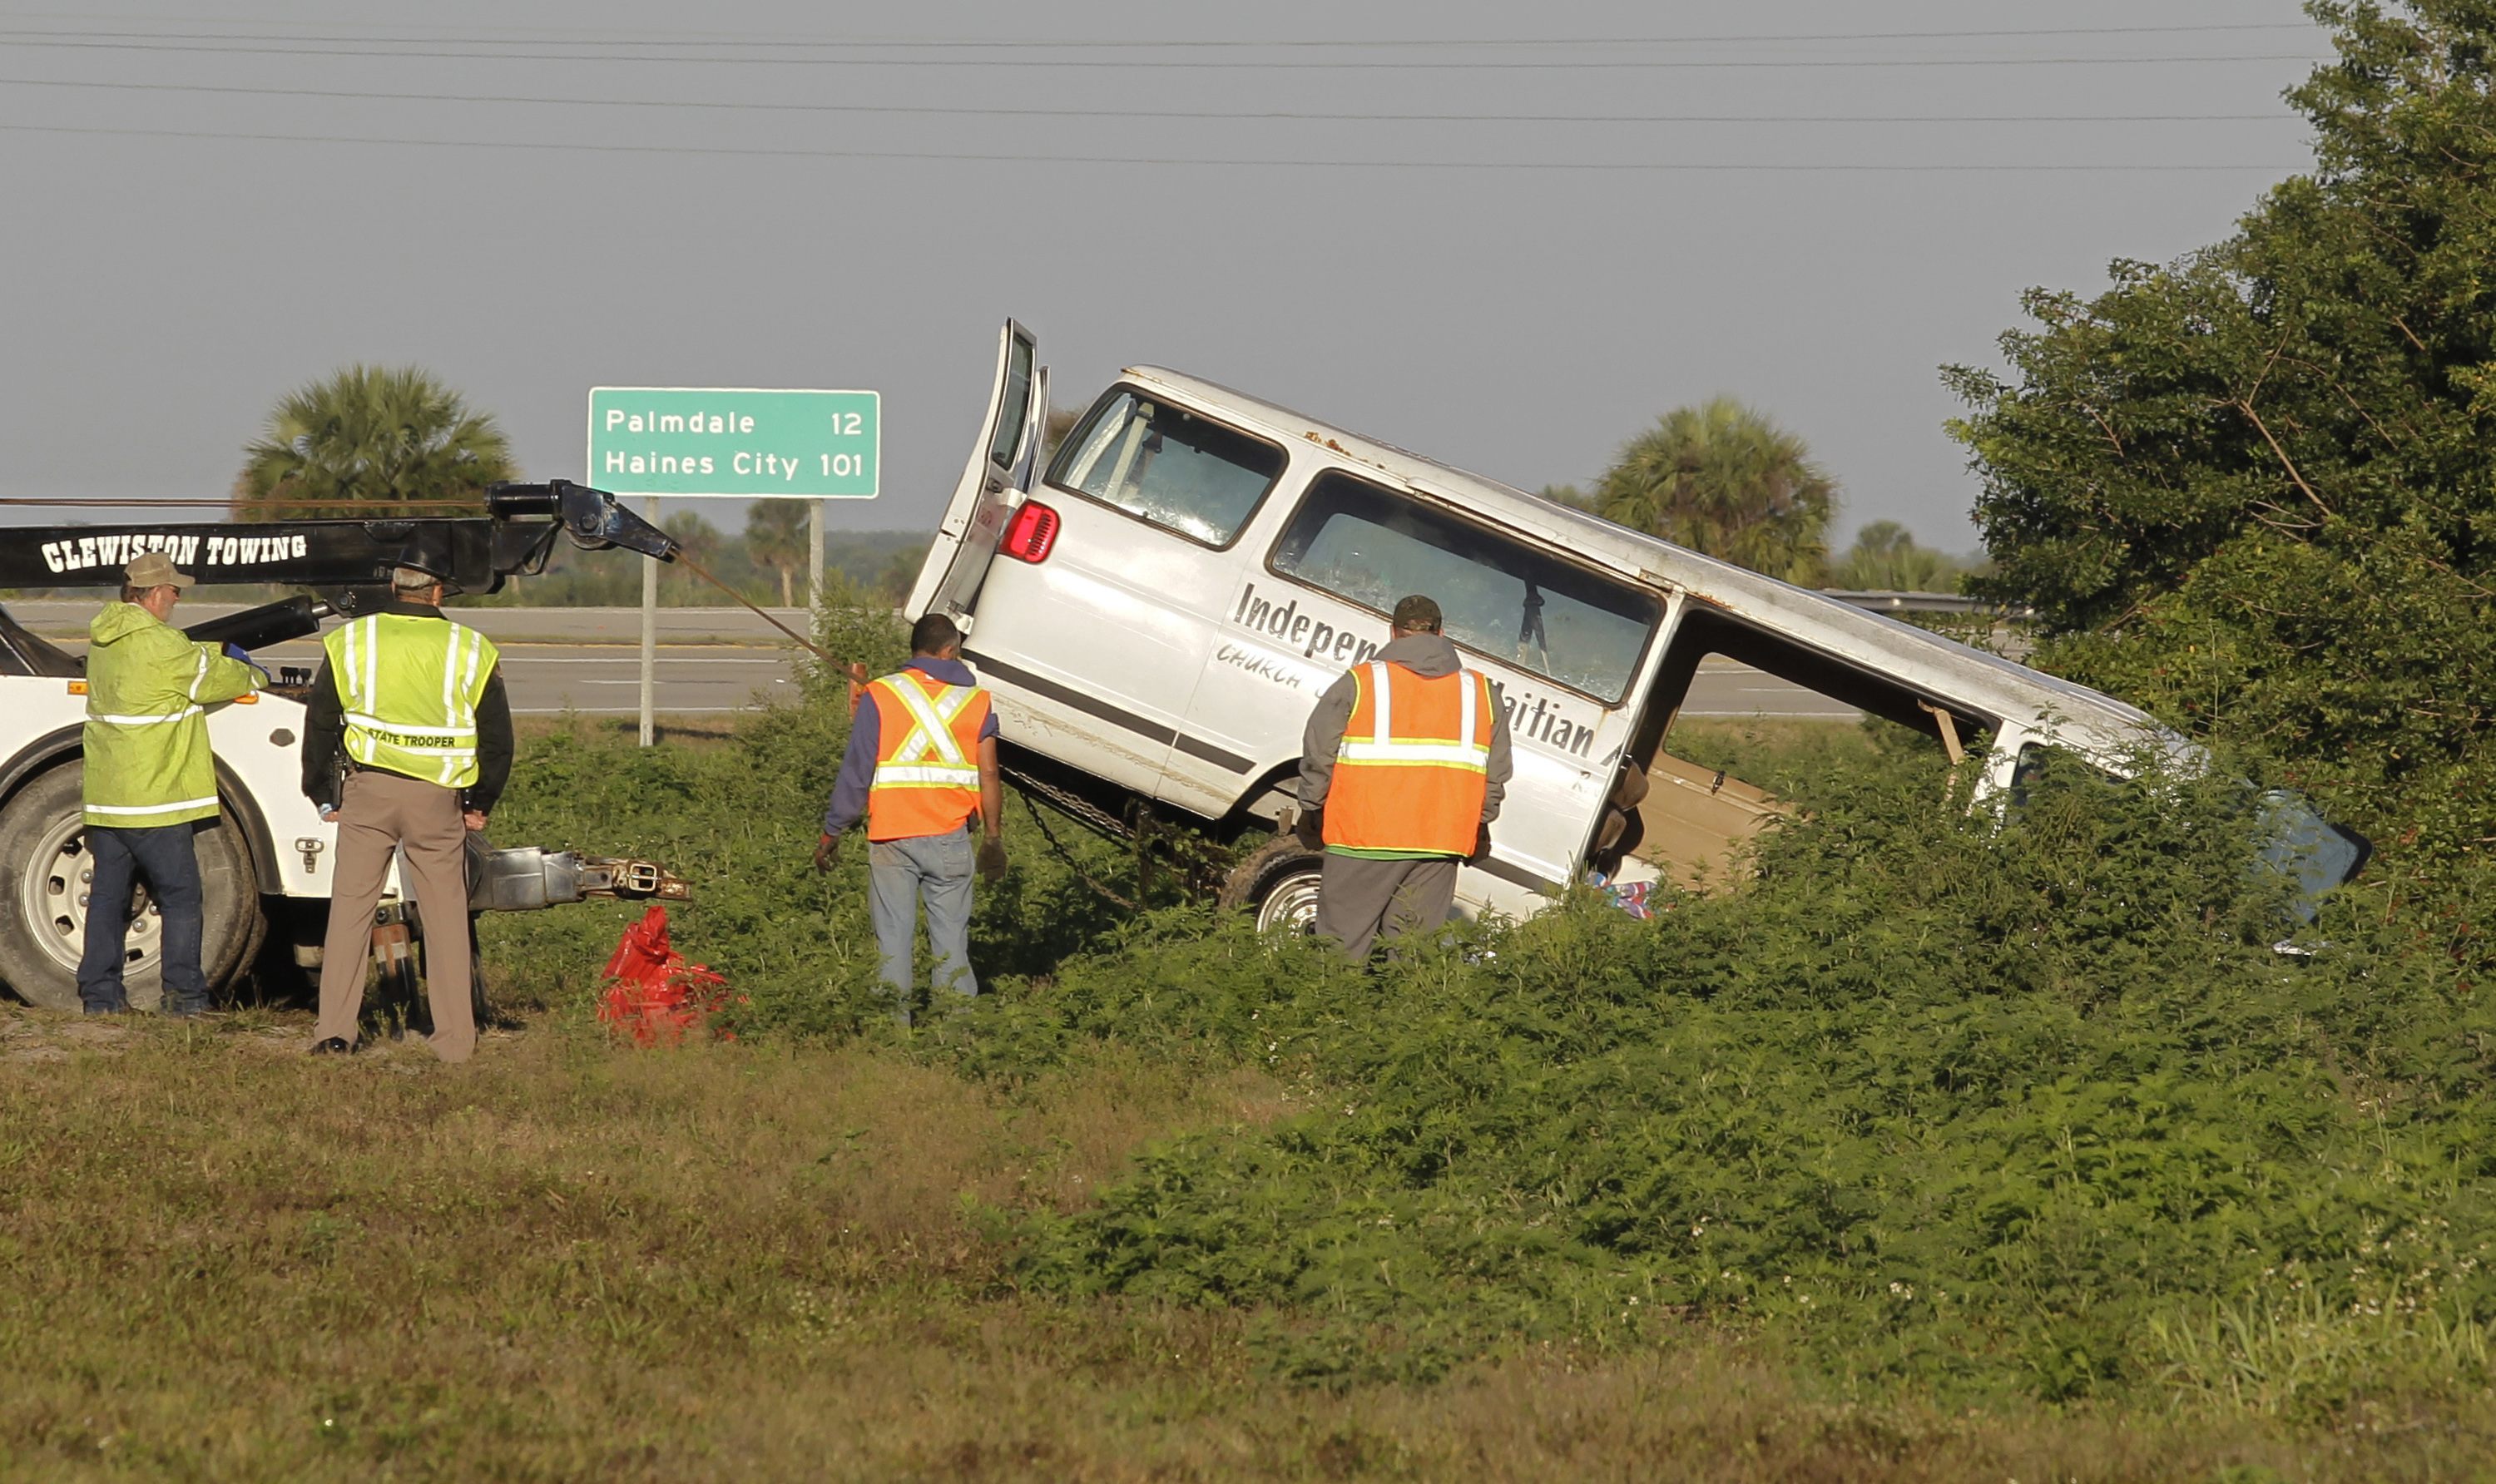
In this March 30, 2015 file photo, workers pull a van out of a canal at the intersection of U.S. 27 and State Road 78 West, near Moore Haven, Fla. Federal transportation officials are investigating the crash that killed eight members of a Florida church who were riding in a type of van that has raised safety alarms for many years. (AP Photo/Luis M. Alvarez)
2. Florida
Here are the 15 states with the highest percentage increase in traffic deaths from 2014 to 2015 (for the first six months of the year), according to NSC data.

Traffic backs up on Interstate 10 as authorities investigate the scene of a fatal accident on Sunday, July 26, 2015, in Phoenix. Multiple people were killed in the rollover crash and several were injured. (Alonso Parra via AP)
15. Arizona (tie with Colorado)
Traffic deaths up 18% over the first six months of 2014.
451 traffic deaths from January 1 through June 30, 2015.
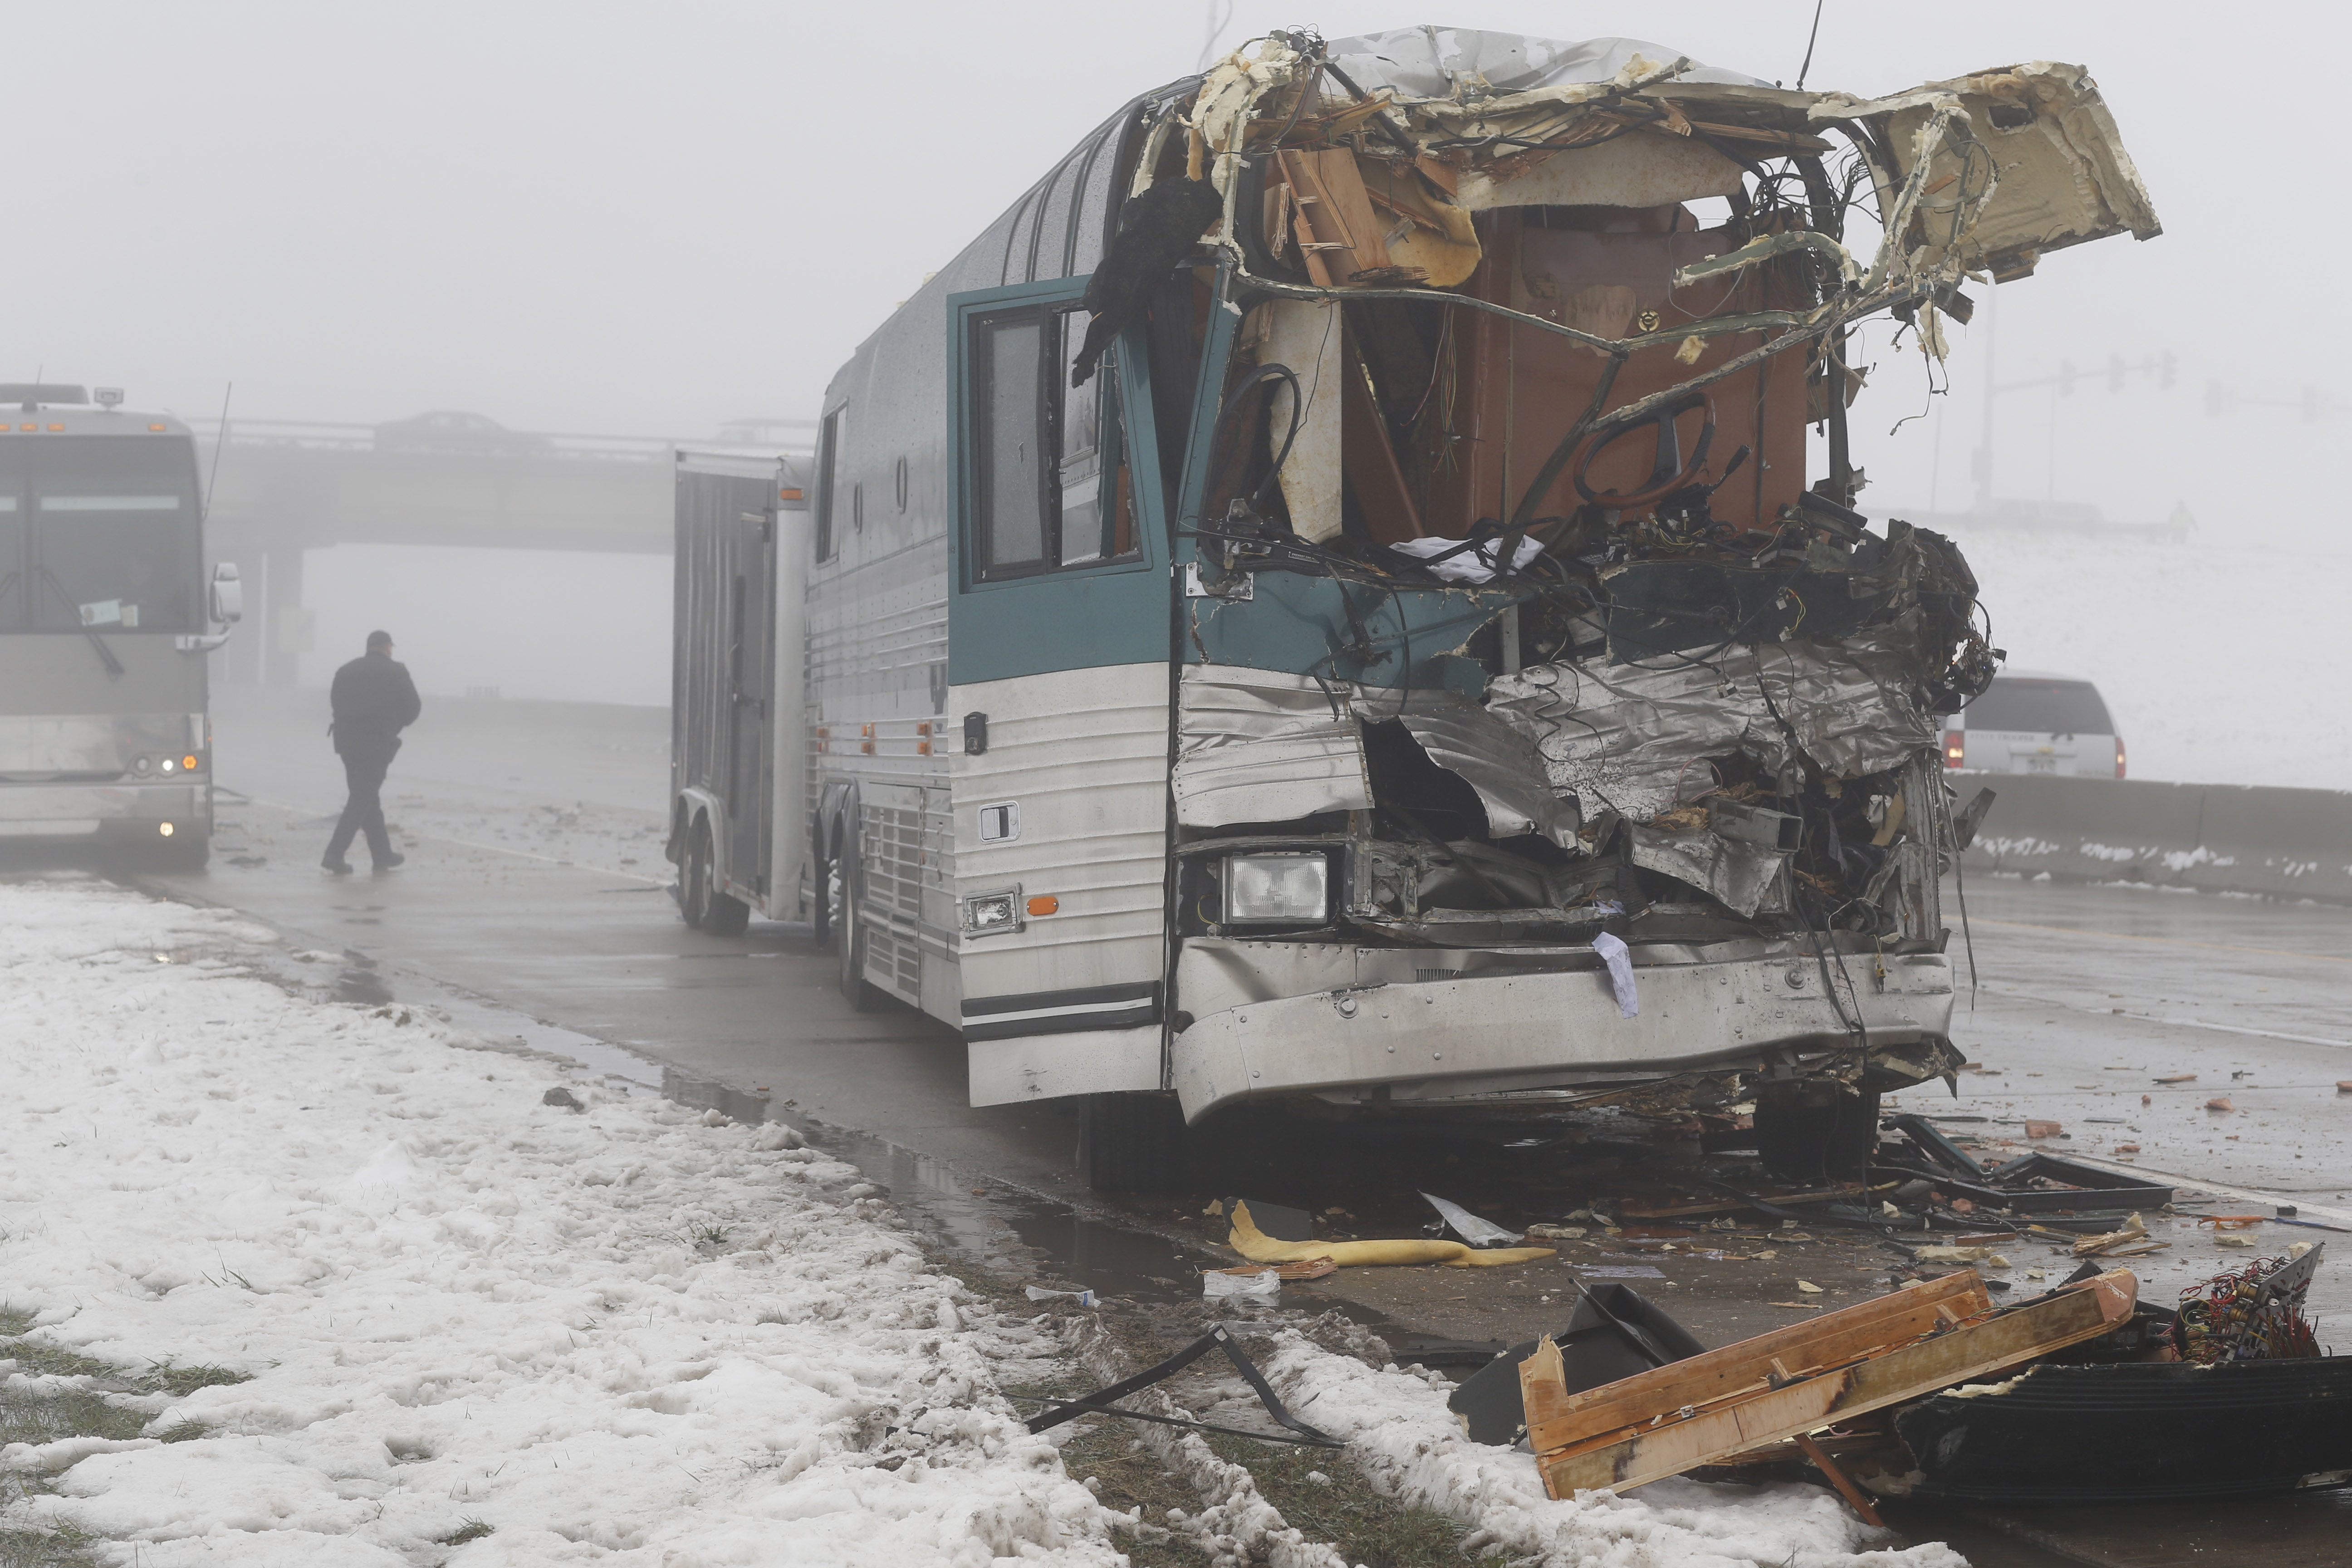
A tour bus involved in an accident with a tractor trailer Friday, April 17, 2015, sits the foreground while the bus that was following sits behind the wrecked vehicle on the shoulder of the westbound lanes of Interstate 70 in Aurora, Colo. Officials say that 12 people were injured, two of them critically, in the four-vehicle wreck that shut down the highway for several hours during a spring storm packing heavy rains and fog. (AP Photo/David Zalubowski)
14. Colorado (tie with Arizona)
Traffic deaths up 18% over the first six months of 2014.
236 traffic deaths from January 1 through June 30, 2015.
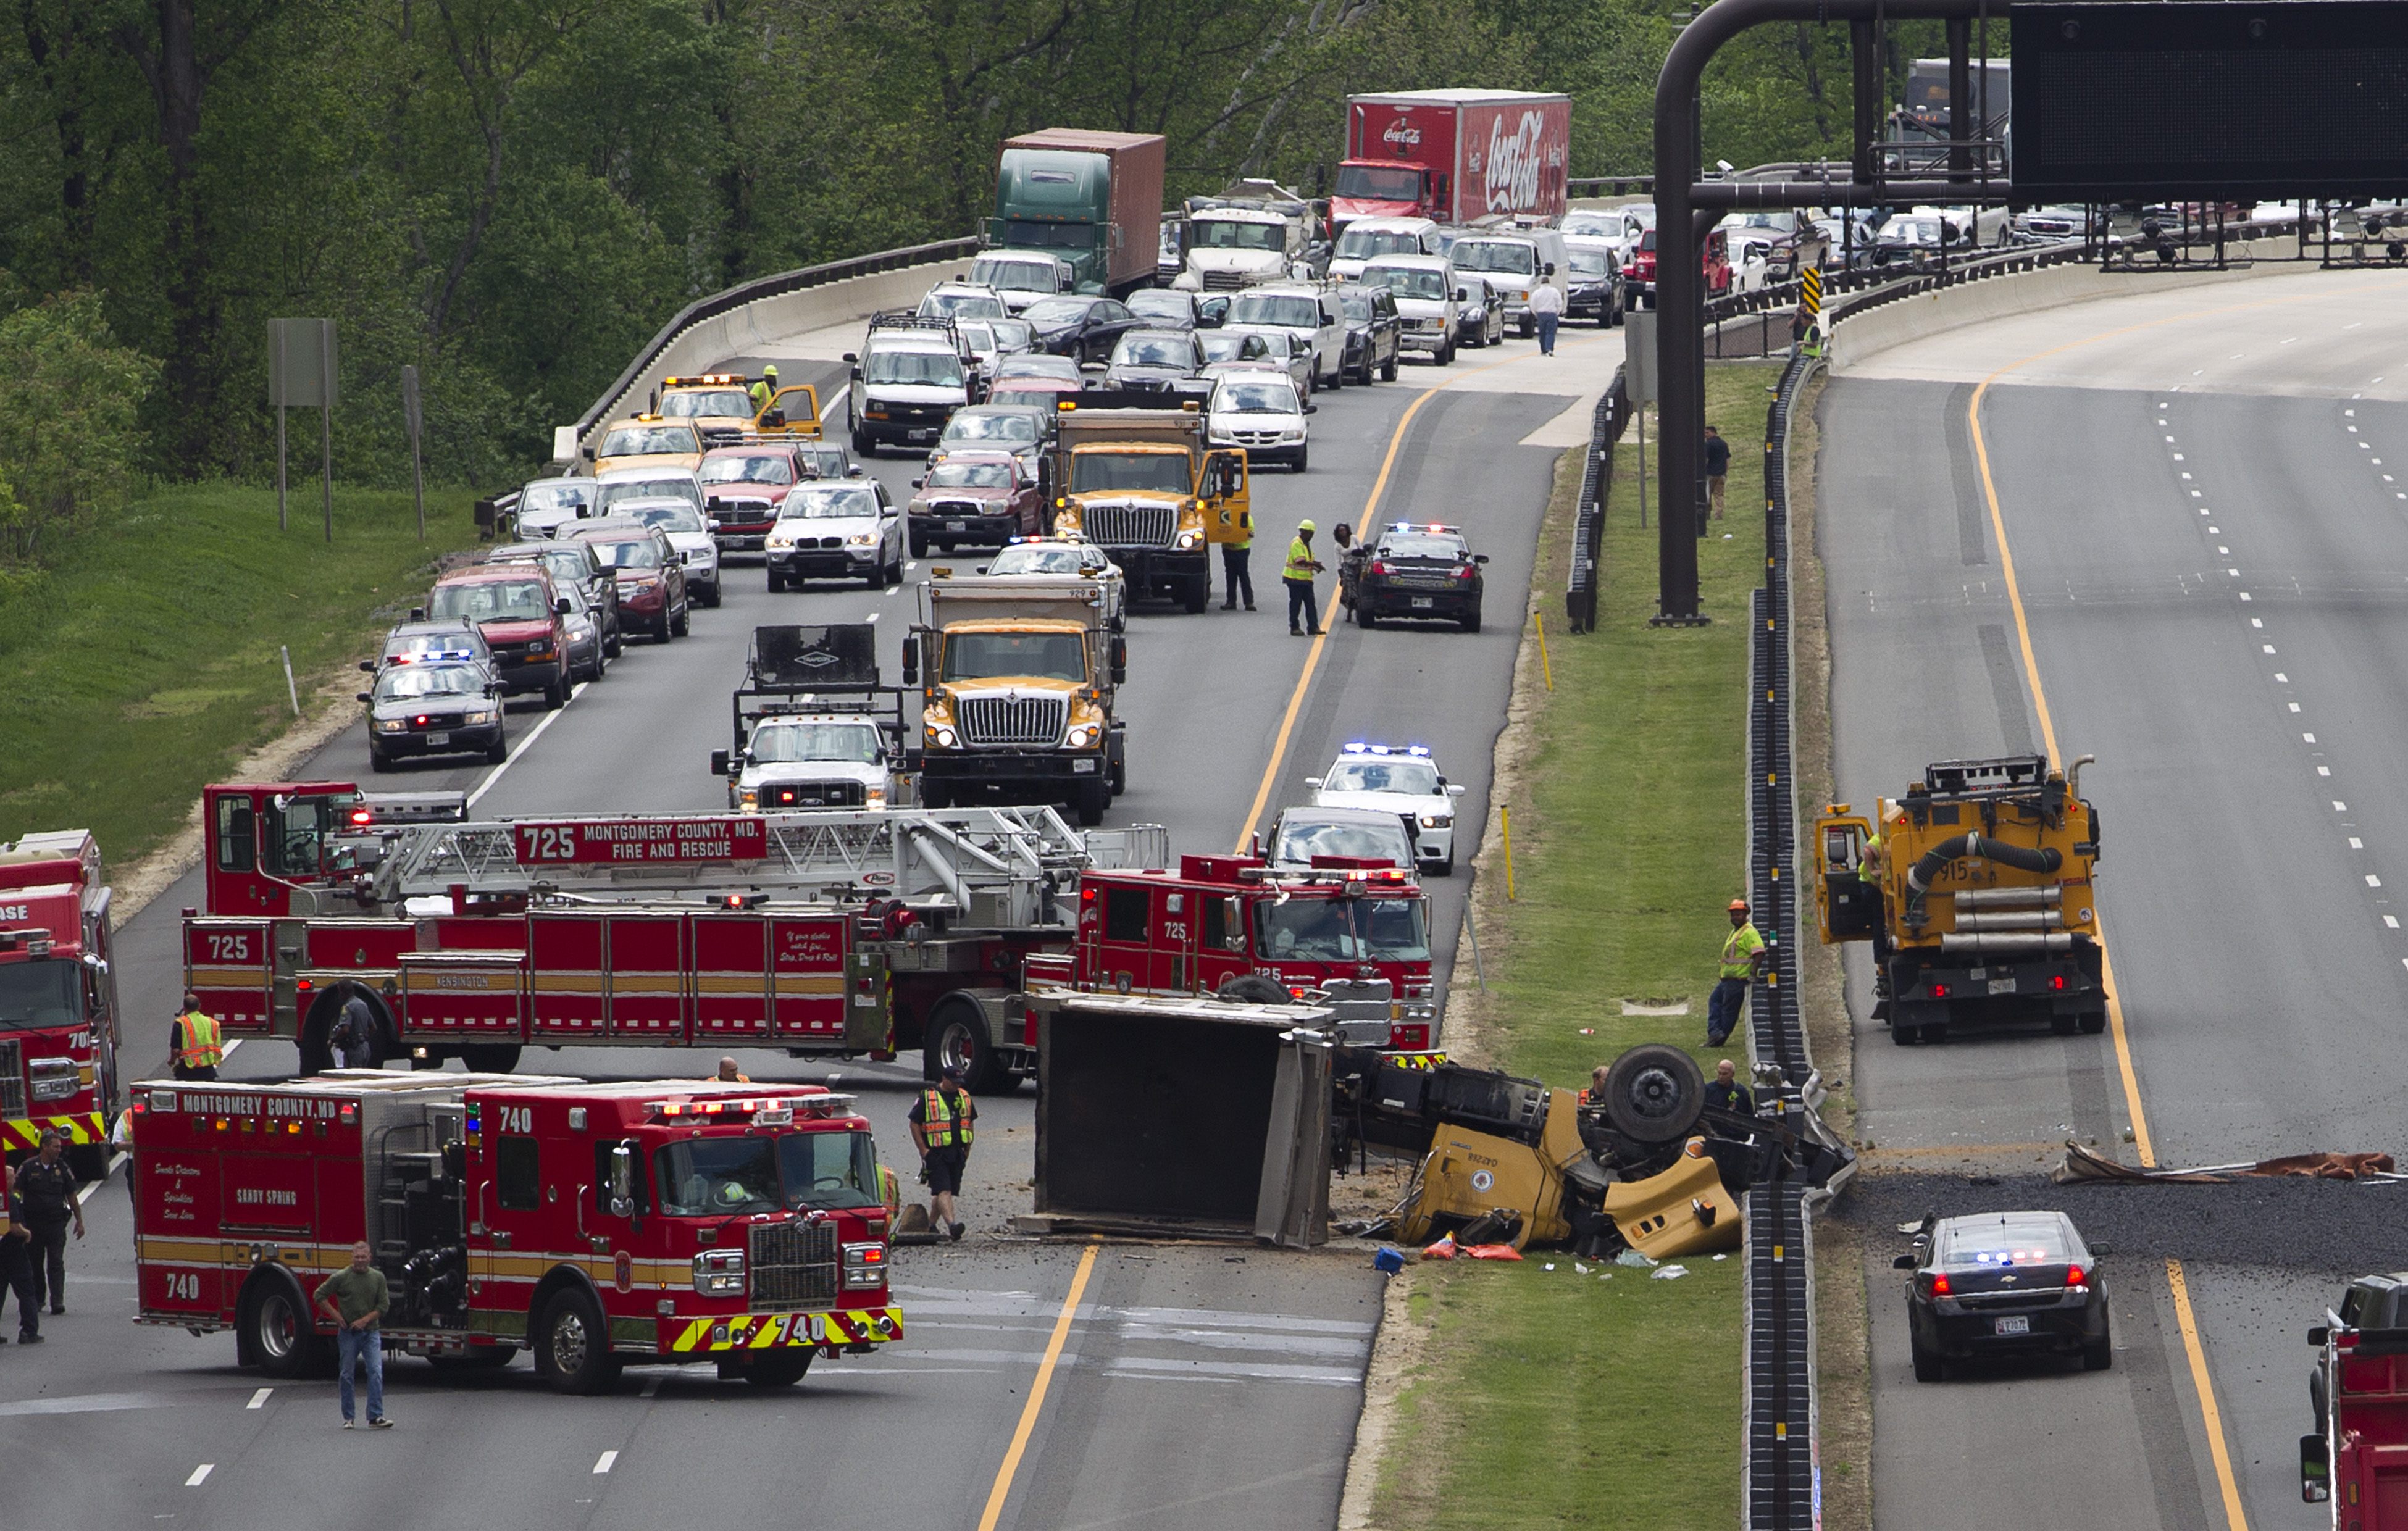
A dump truck crash snarls traffic on the Inter County connector between Layhill Road and New Hampshire Avenue in Silver Spring, Md., Wednesday, May 13, 2015. (AP Photo/Jose Luis Magan)
13. Maryland (3-way tie with North Carolina and Utah)
Traffic deaths up 19% over the first six months of 2014.
224 traffic deaths from January 1 through June 30, 2015.
12. North Carolina (3-way tie with Maryland and Utah)
Traffic deaths up 19% over the first six months of 2014.
634 traffic deaths from January 1 through June 30, 2015.
11. Utah (3-way tie with Maryland and North Carolina)
Traffic deaths up 19% over the first six months of 2014.
129 traffic deaths from January 1 through June 30, 2015.
(Photo: Shutterstock.com)
10. Wisconsin
Traffic deaths up 19% over the first six months of 2014.
254 traffic deaths from January 1, through June 30, 2015.
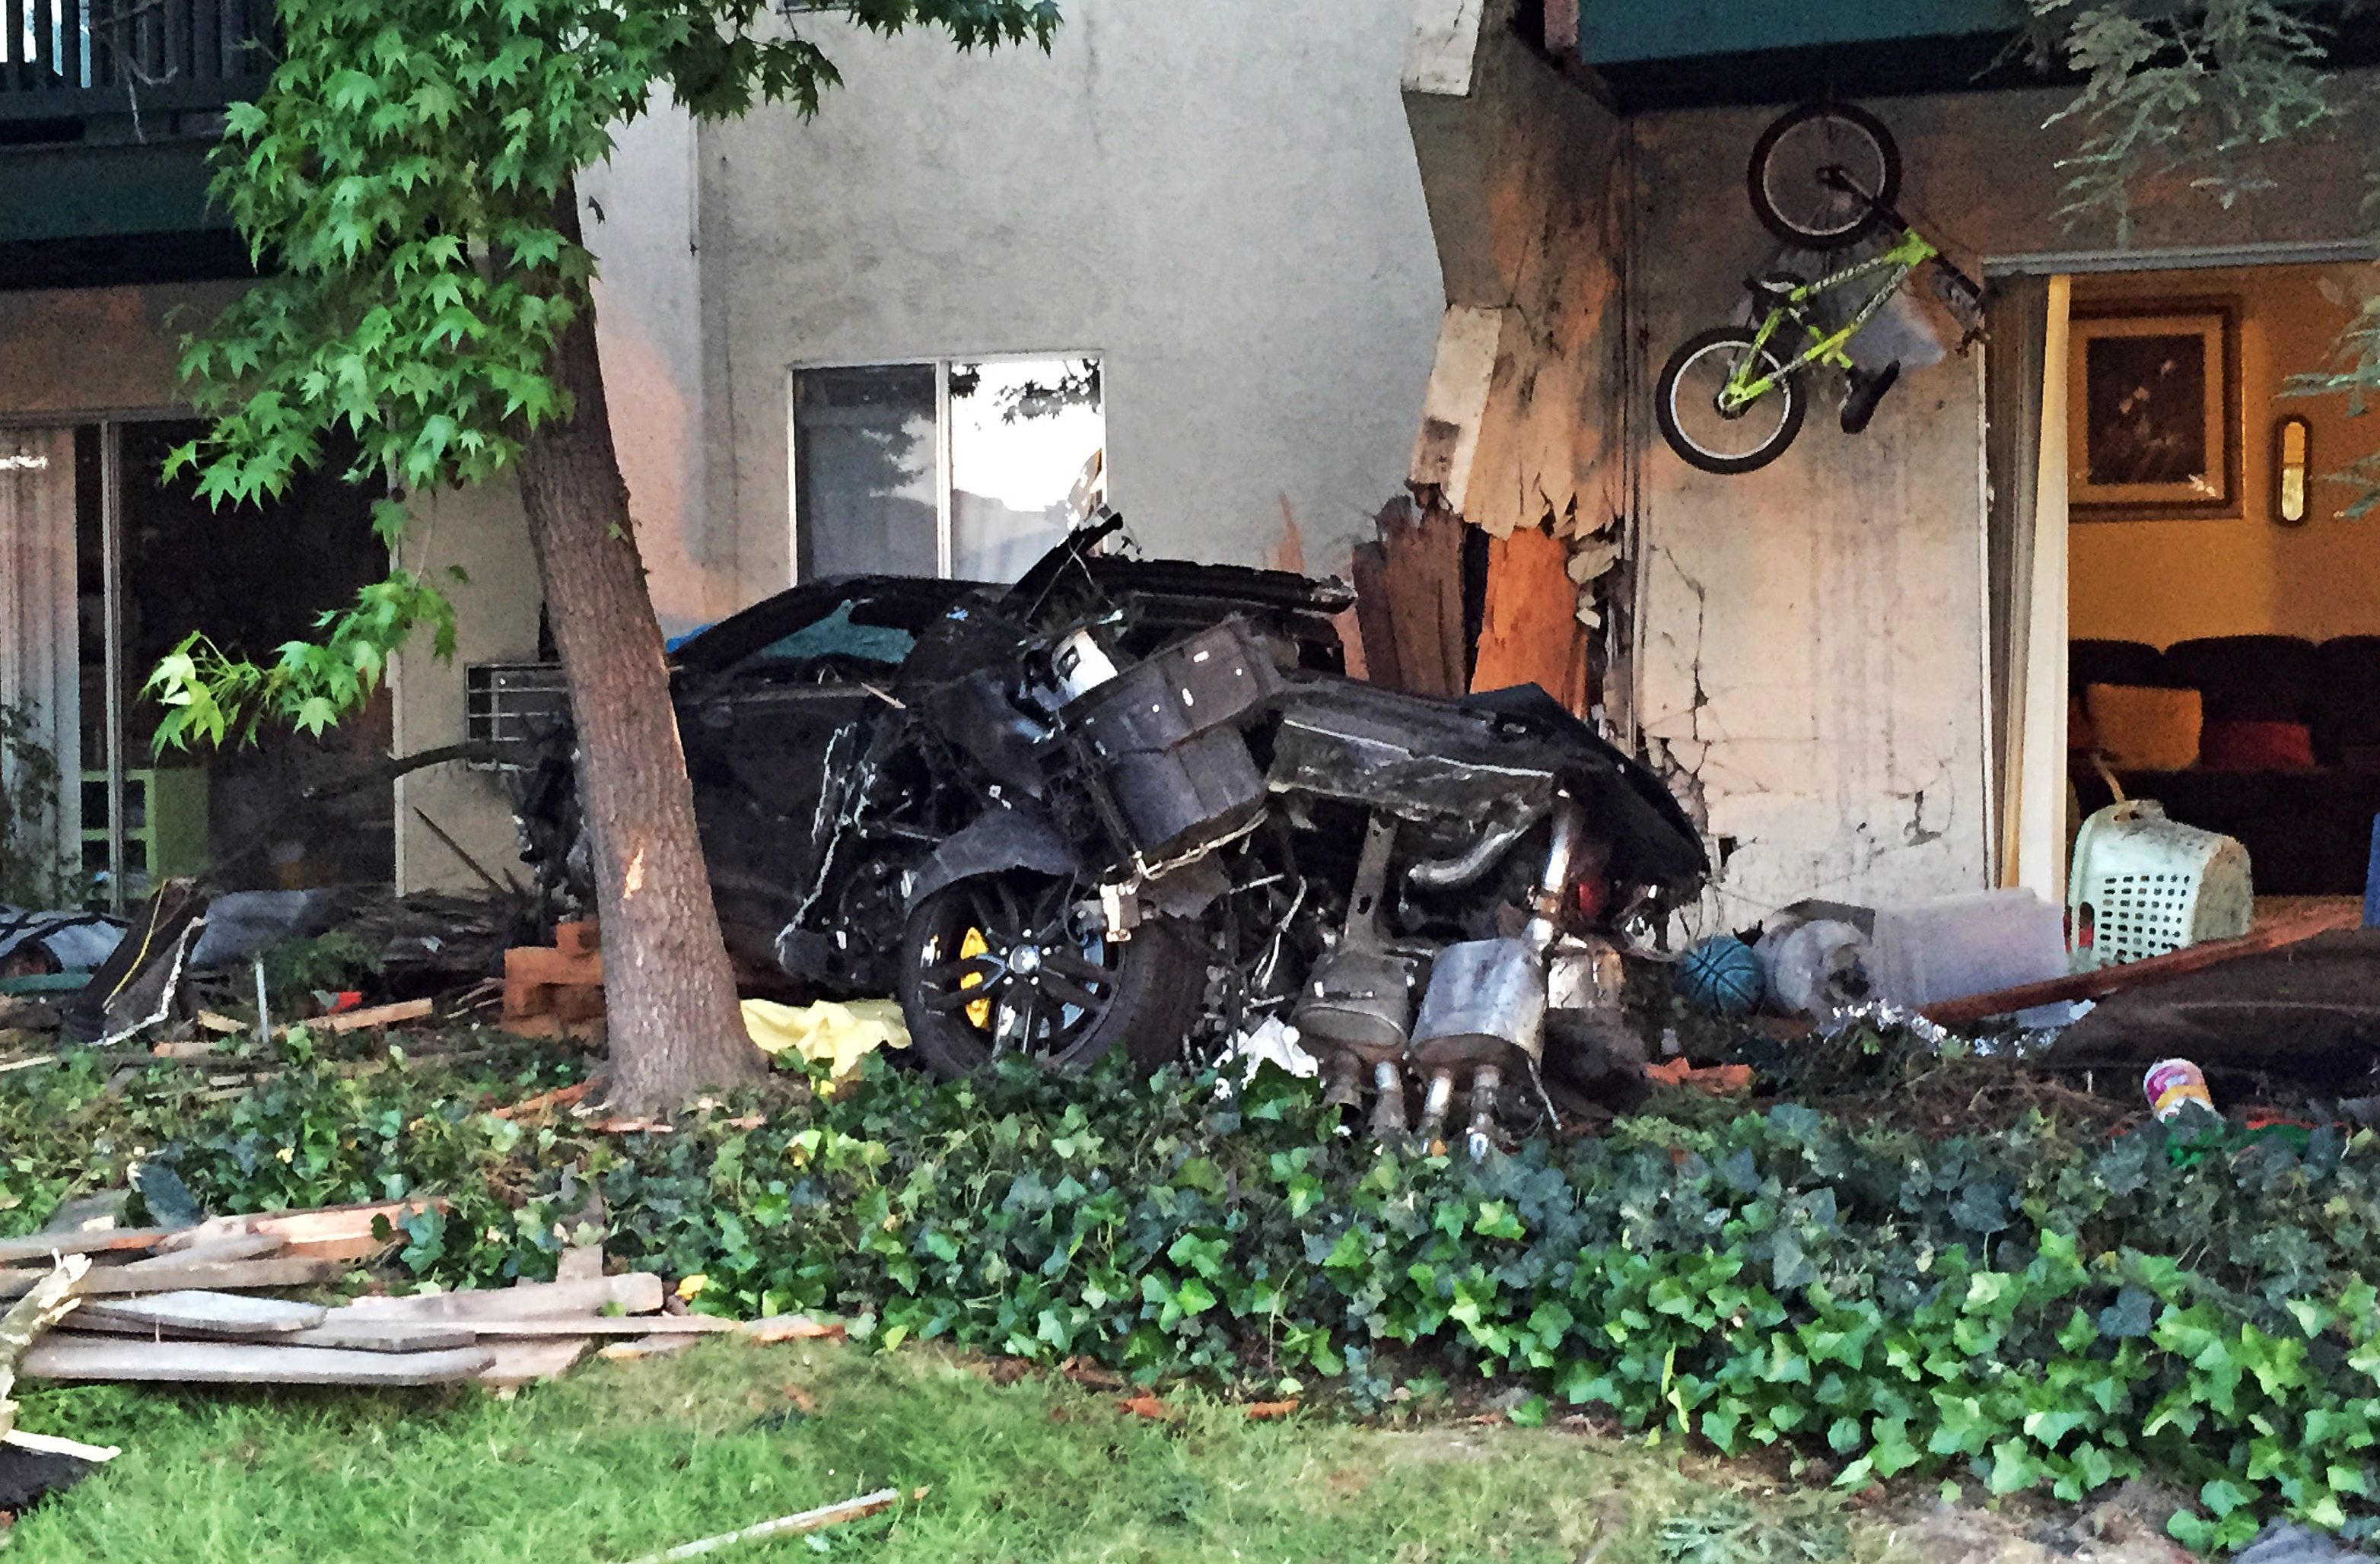
This Saturday, May 2, 2015, photo provided by the Livemore, Calif., Police Department shows the scene after a car crashed into an apartment complex, killing a woman and toddler and slightly injuring two other children, in Livermore in Northern California. Police arrested Brian Jones, of Livermore on suspicion of gross vehicular manslaughter while intoxicated and another alcohol-related driving count, Officer Ryan Sanchez said. (Ryan Sanchez/Livermore Police Department via AP)
9. California (tie with Wisconsin)
Traffic deaths up 20% over the first six months of 2014.
1,566 traffic deaths from January 1 through June 30, 2015.
8. Louisiana (tie with California)
Traffic deaths up 20% over the first six months of 2014.
330 traffic deaths from January 1 through June 30, 2015.
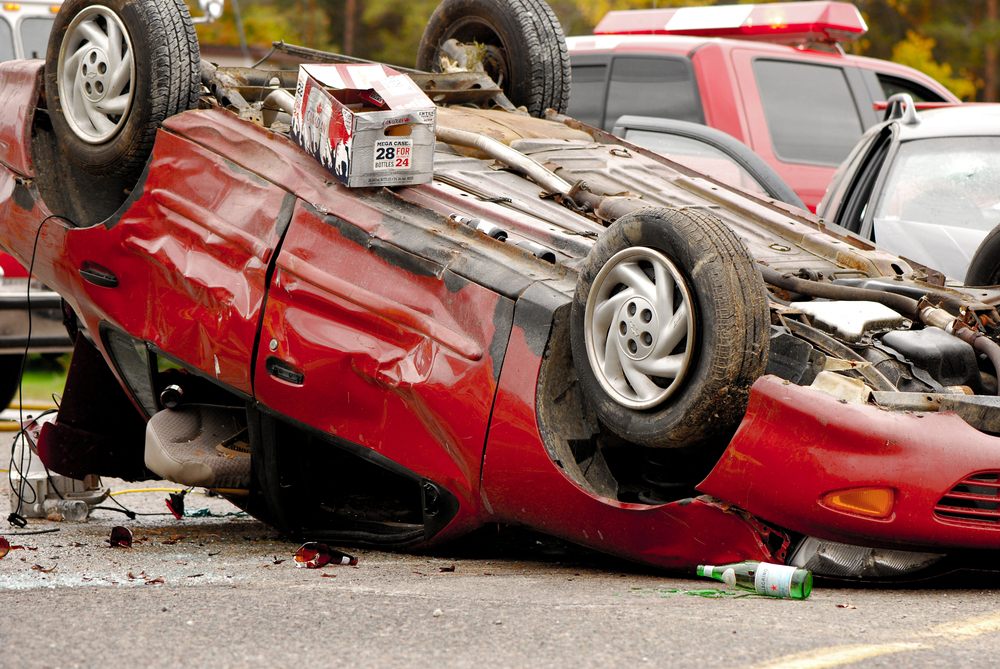
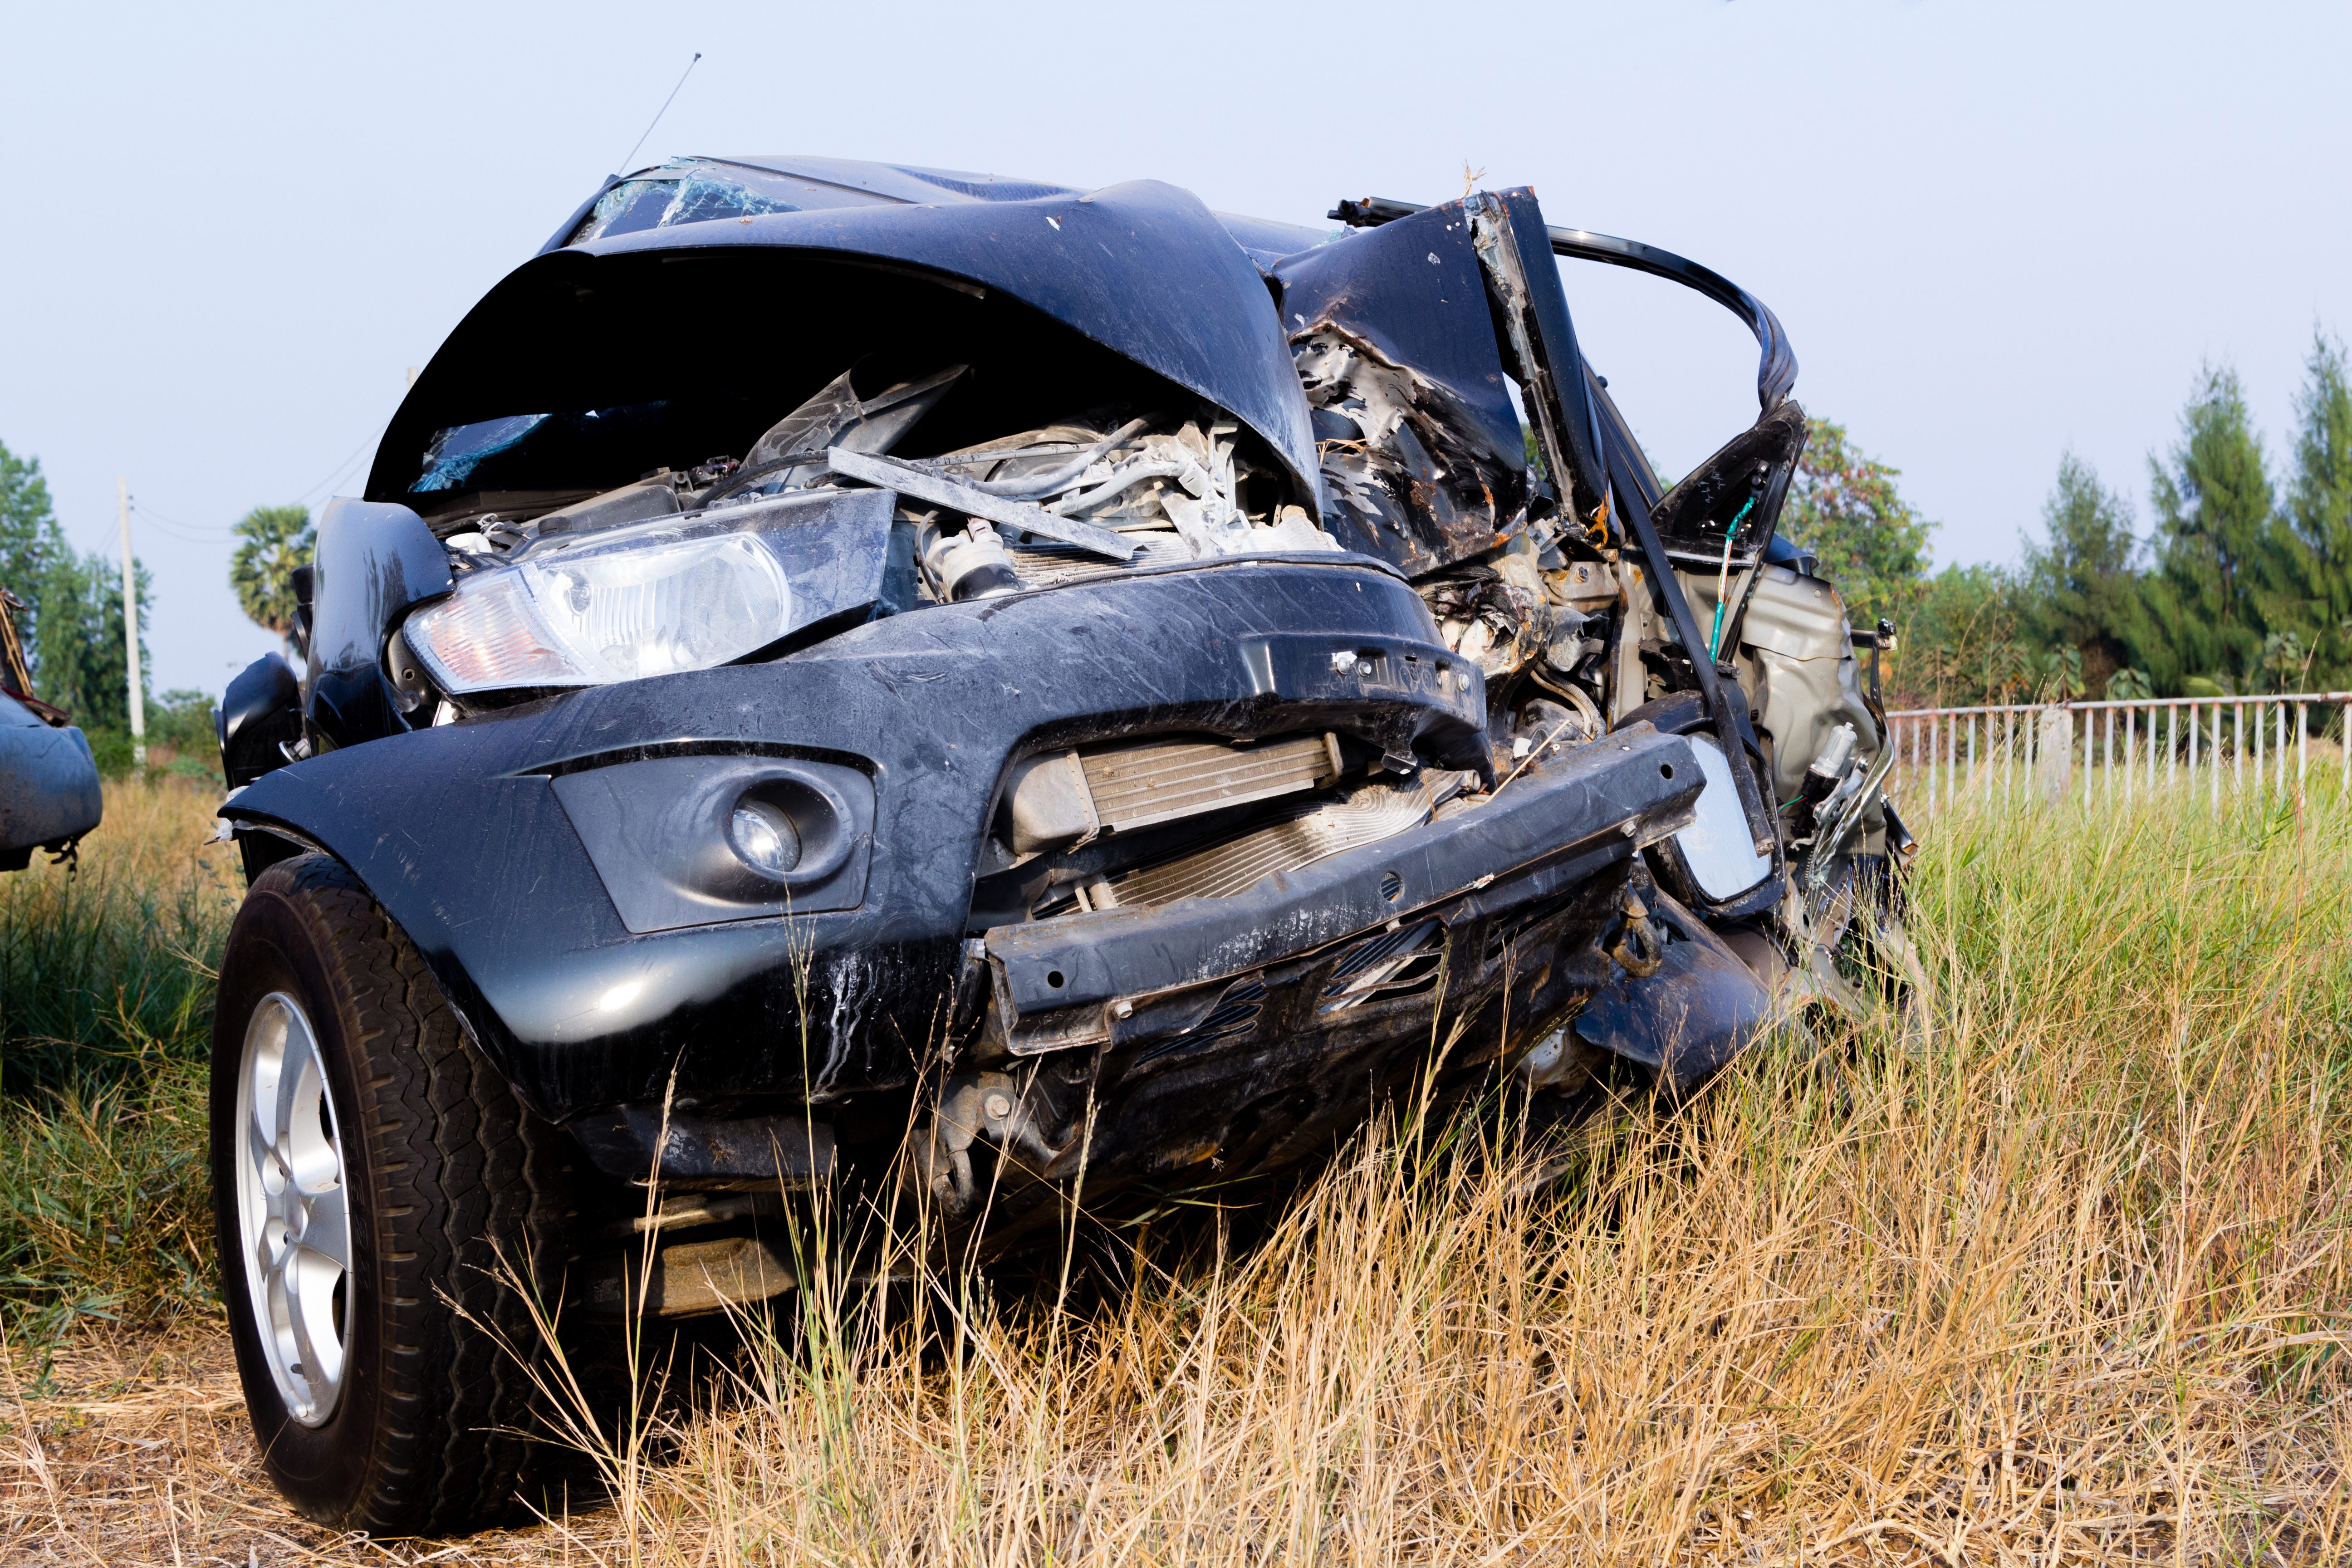
(Photo: Kelly Nelson/Sutterstock.com)
7. South Carolina
Traffic deaths up 21% over the first six months of 2014.
445 traffic deaths from January 1 through June 30, 2015.
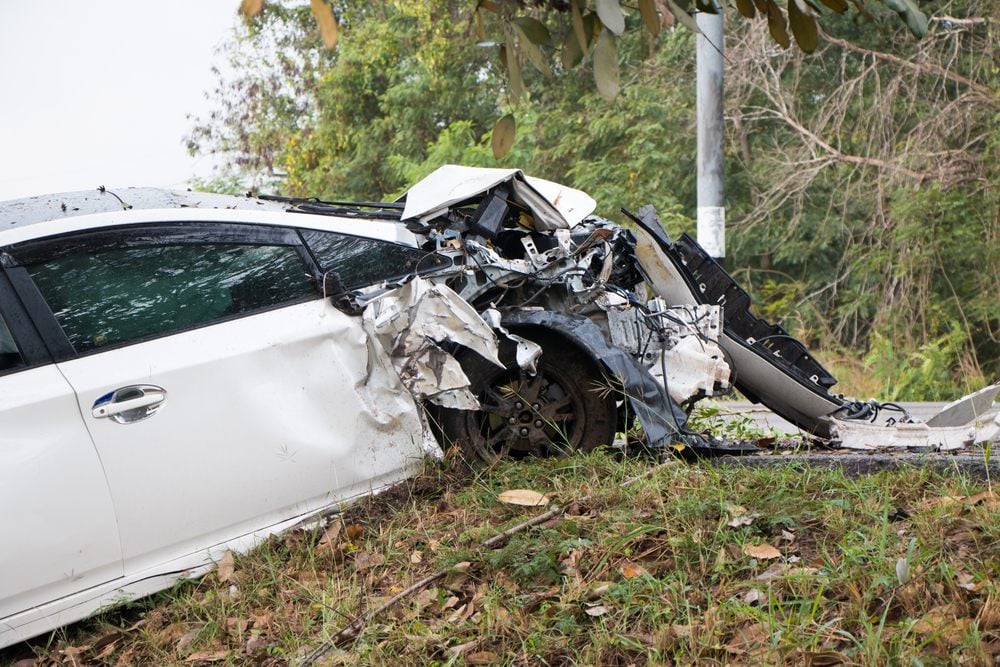
(Photo: Shutterstock.com)
6. North Dakota
Traffic deaths up 22% over the first six months of 2014.
61 traffic deaths from January 1 through June 30, 2015.
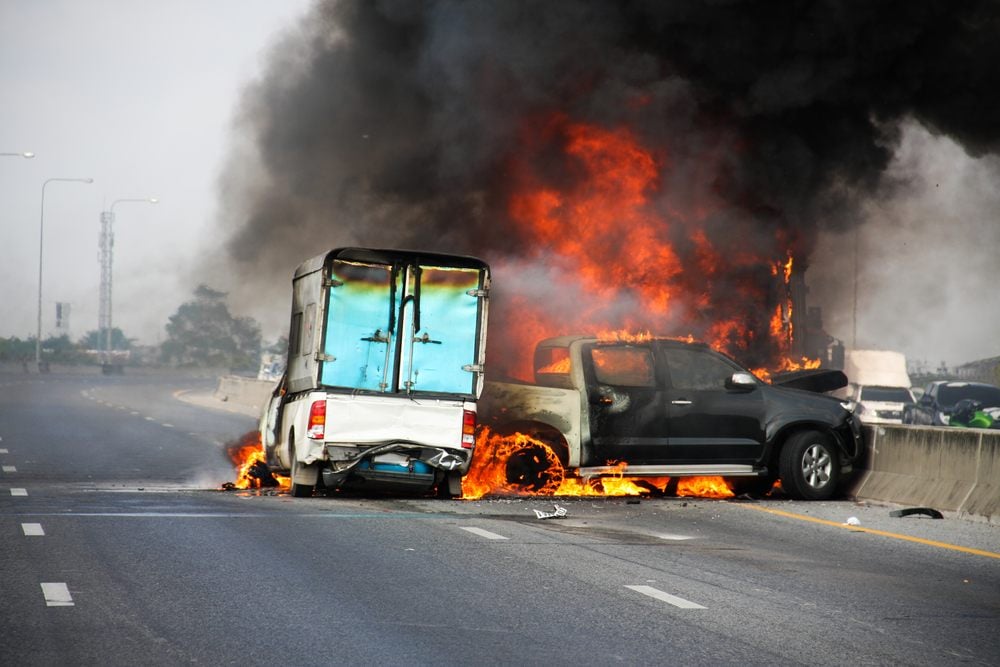
(Photo: Shutterstock.com)
5. Indiana
Traffic deaths up 23% over the first six months of 2014.
356 traffic deaths from January 1 through June 30, 2015.
(Photo: Chris Parypa Photography/Shutterstock.com)
4. Georgia (tie with Minnesota)
Traffic deaths up 26% over the first six months of 2014.
657 traffic deaths from January 1 through June 30, 2015.
3. Minnesota (tie with Georgia)
Traffic deaths up 26% over the first six months of 2014.
187 traffic deaths from January 1 through June 30, 2015.
In this March 30, 2015 file photo, workers pull a van out of a canal at the intersection of U.S. 27 and State Road 78 West, near Moore Haven, Fla. Federal transportation officials are investigating the crash that killed eight members of a Florida church who were riding in a type of van that has raised safety alarms for many years. (AP Photo/Luis M. Alvarez)
2. Florida
Traffic deaths up 29% over the first six months of 2014.
1,441 traffic deaths from January 1 through June 30, 2015.
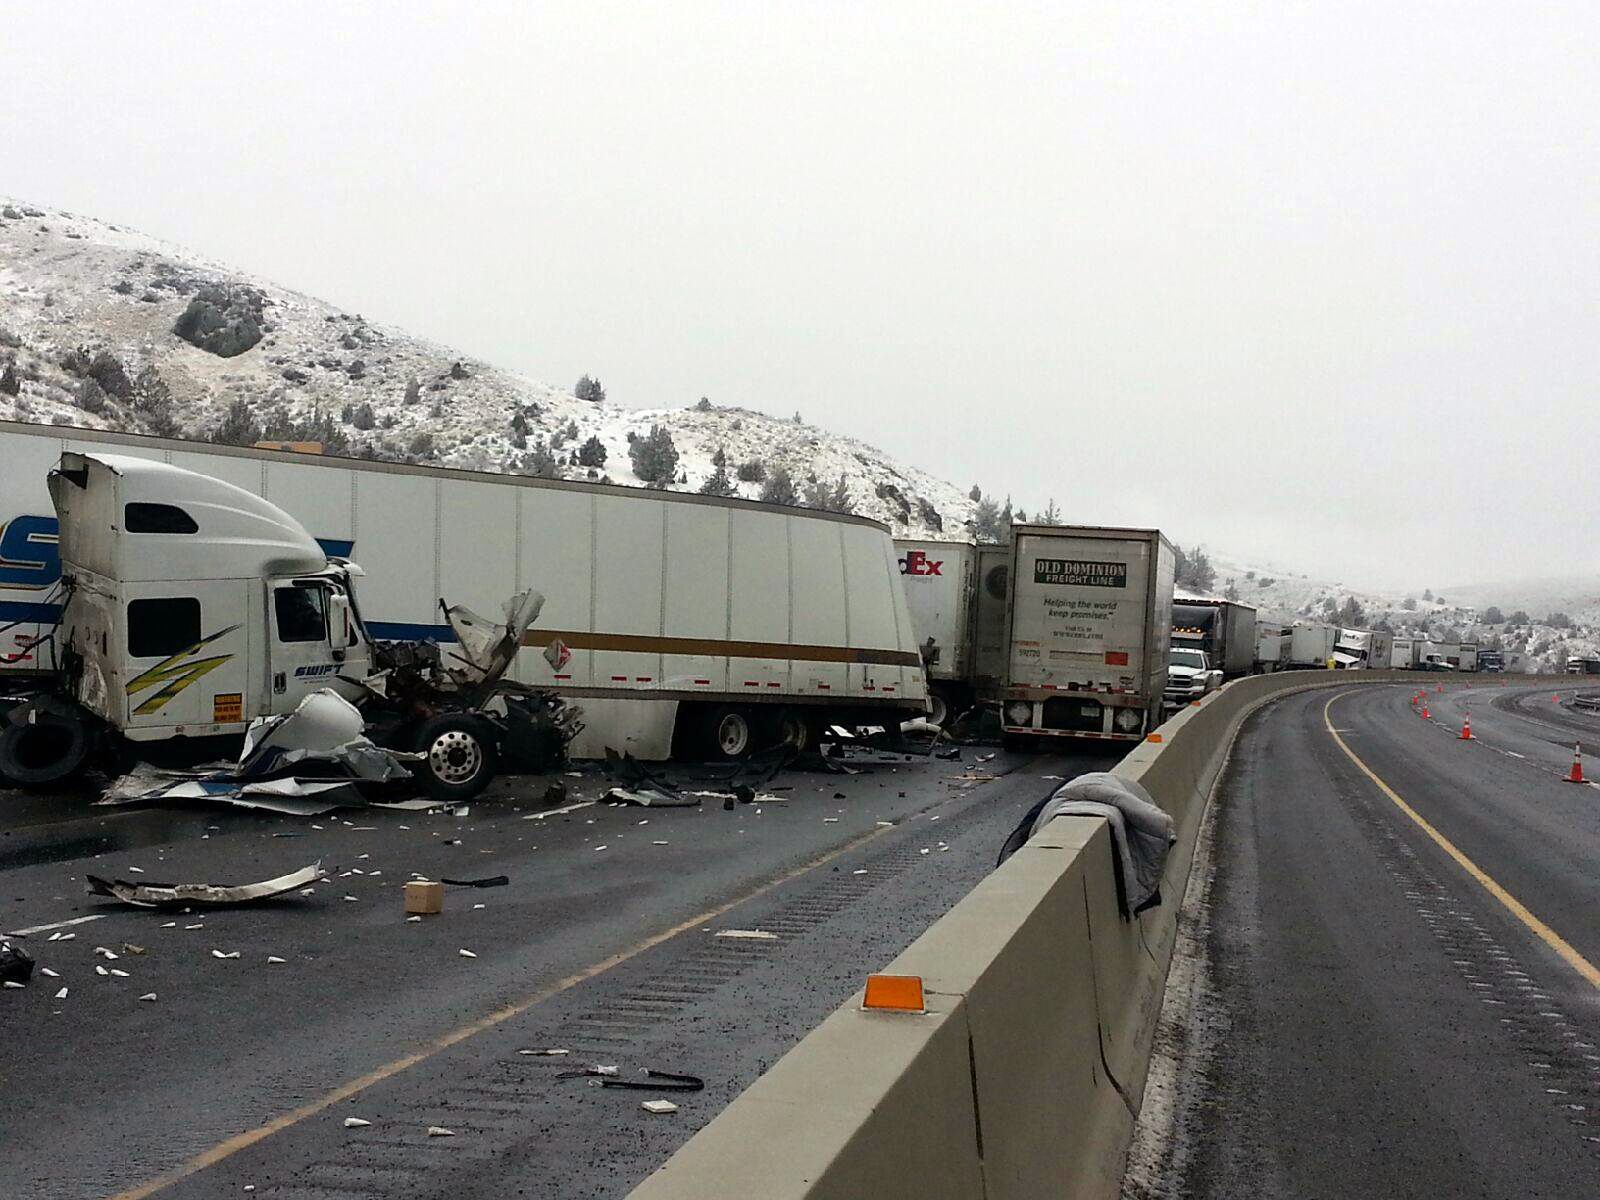
This photo provided by the Oregon Department of Transportation shows the scene of an accident on I-84 in Oregon on Saturday, Jan. 17, 2015. Black ice is believed to be the cause of a freeway pileup involving more than a dozen tractor-trailers Saturday morning in eastern Oregon, police said. (AP Photo/Oregon Department of Transportation)
1. Oregon
Traffic deaths up 59% over the first six months of 2014.
204 traffic deaths from January 1 through June 30, 2015.
Safety tips
To help ensure safety, the NSC has the following recommendations for drivers:
- Make sure every passenger buckles up on every trip.
- Designate an alcohol and drug-free driver or arranging alternate transportation.
- Get plenty of sleep and taking regular breaks to avoid fatigue.
- Never use a cell phone behind the wheel, even hands-free.
- Stay engaged in teens' driving habits. Teens are three times as likely to crash as more experienced drivers.
- Learn about your vehicle's safety systems and how to use them. My Car Does What can help drivers understand the ins and outs of features such as adaptive cruise control, blind spot warning systems and backup cameras.


SINCE 9/11/2001, WE HAVE LOST VERY FEW PEOPLE TO TERRORIST ACTS. BUT WE LOST 500,000 PEOPLE ON THE DEADLY ROADS. AN ADDITIONAL 5 MILLION HAVE BEEN INJURED. OUR PRIORITIES ARE CLEARLY MISPLACED
UNITED STATES STILL HAS ONE OF THE HIGHEST ROAD ACCIDENT DEATH AND INJURY RATES IN THE WORLD: 34,000 DIE AND 2.5 MILLION INJURED EACH YEAR.
Despite the improvements in road safety, the United States has one of the highest death rates at about 1 person dead per 10,000 people. Unfortunately, only undeveloped countries have higher death rate.
Since 9/11/2001, we have lost very few people to terrorist acts. But we lost 500,000 people on the deadly roads. An additional 5 million have been injured. Our spending priorities are clearly misplaced. Investment in our road infrastructure is what is needed, as the economic toll from all these deaths and injuries and property damage has suffocated our economy.
Thus far this year alone, we have lost 18,000 people and an additional 450,000 people have been injured.
Some states, such as Texas and West Virginia (sorry, WV, despite your tremendous progress in traffic safety, you are still at the top of the worst-death-rate list) have death rates of nearly 1.5 percent, i.e., fifty percent more people die compared to the national death rate.
Approximately 34,000 people are getting killed each year. In the 1950s and 1960s, about 55,000 people used to die on the roads – so, there has been improvement in the number of dead.
However, the number of injured is rising. Roughly 2.5 million are injured (yes, you read it correctly – 2.5 million injured) per year. That is, 1 percent (1%) of the population that is eligible to drive is injured every year.
Speeding, aggressive driving, tail gating, lane changes for no reason, pass on the left to make a quick right turn, no signals or late signaling, weaving through traffic, driving while impaired, driving while tired or sleepy, are just few of the traits of bad drivers. The end result is always death or injury or a very close call.
There has been an increase of the number of deaths and injuries to pedestrians, cyclists, mopeds, and motorcyclists. Motorcycles are less stable and less visible than cars and often have high performance capabilities. When motorcycles crash, their riders lack the protection of an enclosed vehicle, so they're more likely to be injured or killed. The federal government estimates that per mile traveled in 2012, the number of deaths on motorcycles was over 26 times the number in cars.
Unfortunately, there is a small number of drivers who are refusing to wait for a train to pass and they are trying to beat it, with often tragic consequences.
It's not worth the game of chicken. The two, three or four minutes you will spend waiting for the train to pass is not greater than the time spent injuring yourself or your vehicle, or even loss of life.
Elderly drivers cause many accidents. We need to force drivers to take driving refresher courses every 5 years or more often. Drivers must also be tested for eye-sight, hearing, drugs, etc. Many thousands of deaths and hundreds of thousands of injuries would be prevented if we do so. Please remember that a vehicle is a lethal weapon and only a regularly-trained, capable and fit person should operate it.
So, in a nutshell, it is worse than a war zone out there.
So, please be safe and be on the lookout for aggressive drivers, weaving-through-the-traffic drivers, crazy drivers, reckless drivers, sick drivers, medical-condition drivers, sleepy drivers, negligent drivers, stupid drivers, careless drivers, drunk drivers, speeding drivers, drugged drivers, texting drivers, talking-on-the-phone drivers, looking-at-the-GPS drivers, hurry-hurry drivers, tailgating drivers, upset drivers, eating-while-driving drivers, putting-the-lipstick-on-while-driving drivers, elderly drivers, and so on.
As we always say: it is better to arrive late at your current destination, than to arrive early at your final destination. Slow down at intersections, let the aggressive drivers go first, it does not worth it getting you or your family injured or killed.
Drive safely. Learn from these deadly accidents and slow down. IF YOU MUST GO, THEN TAKE IT SLOW.
HTTP://METROFORENSICS.BLOGSPOT.COM/2015/08/THE-DEADLY-US-ROADS-WORSE-THAN-WAR-ZONE.HTML
WARNING: DEATHS AND INJURIES ON U.S. ROADS RISE AS ECONOMY IMPROVES.
WARNING: BICYCLE, MOTORCYCLE, SCOOTER AND PEDESTRIAN DEATHS AND INJURIES ARE ON THE RISE