MEC&F Expert Engineers

Friday, October 10, 2014

INSURER AND ENGINEERING INSPECTOR COULD BE LIABLE FOR BAD FAITH DAMAGES IF UNDERESTIMATE STORM DAMAGES

INSURER AND ENGINEERING INSPECTOR COULD BE LIABLE FOR BAD FAITH DAMAGES IF UNDERESTIMATE STORM DAMAGES


AMTRAK, PSE&G AND NJ TRANSIT HAVE SUED THEIR INSURERS ALLEGING SANDY DAMAGES NOT SUBJECT TO THE FLOOD SUBLIMITS.  THE TOTAL DAMAGE COSTS CONTINUE TO BE REVISED UPWARDS.


As has been expected, litigation will be centered on a few types of disputes, from gale-force wind or wind-versus-flood determinations, flood versus wind-driven rain determinations, to business interruption claims to alleged negligence by insurance brokers to failure to protect one’s property despite the storm warnings.
Flood insurance covers direct physical losses by flood and losses resulting from flood-related erosion caused by heavy or prolonged rain, coastal storm surge, snow melt, blocked storm drainage systems, levee dam failure or other similar causes.  To be considered a flood, waters must cover at least two acres or affect two properties.  Homes are covered for up to $250,000 on a replacement cost basis and the contents for up to $100,000 on an actual cash value basis.  Replacement cost coverage pays to rebuild the structure as it was before the damage.  Actual cash value is replacement cost minus the depreciation in value that occurs over time. (Excess flood insurance is available in all risk zones from some private insurers for NFIP policyholders who want additional coverage or where the homeowner’s community does not participate in the NFIP.)  Coverage for the contents of basements is limited.  Coverage limits for commercial property are $500,000 for the structure and another $500,000 for its contents.
Homeowner, renter and business owner insurance policies DO NOT cover flooding. Generally, policies will cover wind, rain, hail, wind-driven rain, and lightning damage.  A separate flood insurance policy is needed to protect homes, businesses and personal property against flood damage.  If a home, business or other residence is in a FEMA-identified high risk flood zone, a separate flood insurance policy should have been required on a mortgage transaction.
Rain or wind-driven rain, and hail damage are not in the same damage category as floods.  Wind-driven rain damage, regardless of the cause, is a covered peril like wind or lightning which may have caused an opening in which rain has entered and caused water damage to the home or personal property.
If people affected by Hurricanes Sandy have suffered both flood and wind-driven rain damage, it should be reported to the flood insurance carrier as well as to the homeowner, tenant, or business owner insurance carrier.  It is likely that a separate adjuster would have been assigned for each claim. Adjusters should have communicated with each other to coordinate information prior to final settlement.
The burden of proof required under a flood policy versus a wind policy will be equally important. A wind policy is often written as an "all risk" insurance policy, and a flood policy is written as a named peril policy.
As long as the insured presents evidence making a prima facie showing that wind caused substantial damage to their home, the insured will not be required to present further evidence negating the possibility that the damage was caused by water and the burden will instead shift to the insurer to prove the extent of damage caused by water. This, in turn, will make it easier for the insureds to recover under their homeowner’s policies, and more difficult for the insurers to avoid coverage under their policy exclusions.

Hurricane (or Storm or Superstorm) Sandy
In late October 2012, Hurricane Sandy caused widespread damage to buildings across the entire affected area, as well as widespread power outages and interruptions in utility service.  Hurricane Sandy brought large-scale flooding to coastal and riverine residential and urban areas, particularly concentrated along the New Jersey and New York coastlines. Although the effects of Sandy were felt along much of the northeast coast, New Jersey and New York sustained the worst impacts from the storm.  New Jersey was expected to sustain such severe damages due to the almost reckless defiance of common sense in allowing the building of numerous and expensive dwellings in the floodplains along the coast line.  New Jersey has been aggressively pursuing for many years federal dollars to haul sand to the beach (the so-called “sand dollars”) to “nourish the beaches.  Basically they brought sand to the beach, pilled it up over the years and built their homes, most of them not meeting modern floodplain design standards.
Most of the damage observed was caused by flooding (hydrostatic, hydrodynamic, buoyancy, and wave loads).  These flooding forces caused inundation of the structures, erosion and scour, and wave action.  Although inundation alone was a significant source of damage, some of the more dramatic structural failures observed were a result of the added force of wave action.  Many buildings, both residential and non-residential, were inundated at the basement and first floor levels, which disrupted operations and damaged utilities, causing significant repair costs and extensive loss of income.


Observations of damage caused by wind were rare, and wind damage was much less significant than the flooding damage.  This does not include the consequential effects of wind damage, such as tree fall, which in turn caused extensive power outages and damages to the electrical distribution grid.  In our community, for example, the two electric substations were destroyed due to the tree strikes knocking down the power lines and transformers.
Forensic observations of the damage and review of the meteorological records indicated that the wind speed of Hurricane Sandy was below a design wind event.  However, the flooding caused by Hurricane Sandy was in excess of the 1-percent-annual-chance flood event across much of the area impacted by the storm.  The 1-percent-annual chance flood event is used as the minimum NFIP design requirement by those communities that have adopted the NFIP.  The storm caused significant flooding and erosion in most of the areas the forensic investigators visited.  Flooding caused widespread damage to structures, critical facilities, and infrastructure. Most damage to low-rise buildings resulted from inundation, and oceanfront low-rise buildings were damaged by wave action, erosion, and scour.  Many low-rise one- and two-family dwellings in coastal areas were of older construction that pre-dates community adoption of floodplain regulations.  Very few of these homes were elevated to the appropriate base flood elevation (BFE).  Most damage to mid- and high-rise buildings resulted from the inundation of mechanical, electrical, plumbing, and other critical systems. Many of these systems were not elevated to or above the BFE.  In addition to building damage, utility outages were widespread.


The NJ Transit Suit
On October 1, 2014, NJ Transit filed a suit in Newark, New Jersey against its insurers (Lloyd’s of London, et al[1]) for up to $300 million in additional coverage it says it is owed for damages incurred during Hurricane Sandy, after the insurance companies insisted on capping coverage at the flood sublimit of $100 million.
In addition to Lloyds, the suit names U.S. insurers Hudson Specialty Insurance Company, Maiden Specialty Insurance Company, RSUI Indemnity Company, Torus Specialty Insurance Company, and Westport Insurance Corporation.
Many of NJ Transit's trains, buses, tracks, stations and other assets were damaged by the salt-water storm surge that overwhelmed the region in October 2012.  The agency estimates total damage from Sandy at $625 million, with the agency anticipating $342 million in federal relief funds.  Flooding of the agency's Hoboken and Kearny rail yards alone caused $120 million in damage to NJ Transit trains.
The suit insists that the agency's policies explicitly covered any "Named Windstorm" for up to $400 million in damage, and challenged insurers' contention that coverage was subject to a "Flood Sublimit" of $100 million.
The policies sold by defendants to NJ Transit have been component of a $ 400 million complete insurance system, the lawsuit says. The policies supply coverage in 4 layers above a per-occurrence deductible of $ 500,000.
The 1st layer of coverage is $ 50 million, the second layer of coverage is also $ 50 million, the third layer is $ 175 million, and the 4th layer is $ 125 million. With the exception of the initial layer presented by AIG’s Lexington Insurance coverage Co., which is not a defendant in this lawsuit, numerous insurers including defendants are accountable for the coverage accessible in every single layer, with each and every organization assuming a particular percentage of every layers’ coverage limit.
In wake of Sandy, NJ Transit immediately notified its broker Marsh and all of its carriers, like defendants, of the harm it sustained. And above the following many months, inspections, valuations, and required repairs proceeded, with NJ Transit keeping all of the carriers informed as total harm estimates produced, the lawsuit says.

In April 2013, NJ Transit obtained a letter from defendants that stated the insurers believed all Sandy-associated water injury fell with their policies’ definition of flood and that they would spend no more than the flood sublimit of $ 25 million, or $ 50 million in excess of the initial-layer coverage offered by Lexington Insurance coverage Co., in accordance to the complaint.
In December 2013, excess insurers agreed to spend the $ 50 million in mixed policy limits of the 2nd-layer policies, which, when mixed with the $ 50 million that NJ Transit’s major insurer had previously paid, brought NJ Transit’s total insurance recovery to $ 100 million — the flood sublimit.
The lawsuit says NJ Transit has not received any more payment of the remaining $ 300 million in coverage from defendants or any other insurer since then.  NJ Transit argues in the lawsuit that it is entitled to a declaration that the flood sublimit in the policies does not apply to the losses triggered by Sandy and its ensuing storm surge. NJ Transit says defendants should shell out for the total amount of NJ Transit’s losses from Sandy, up to the policies’ general restrict.


The PSEG Damages
In late October 2012, Superstorm Sandy caused severe damage to PSE&G's T&D (transmission and distribution) system throughout its service territory as well as to some of Power's generation infrastructure in the northern part of New Jersey.  Strong winds and the resulting storm surge caused damage to switching stations, substations and generating infrastructure.  The damage appeared to be caused by a combination of wind damage and flood damage.
The Power division of PSEG had incurred $79 million and $85 million of storm-related expense in 2013 and 2012, respectively, primarily for repairs at certain generating stations in Power's fossil fleet.  These costs were recognized in O&M Expense, offset by $25 million and $19 million of insurance recoveries in 2013 and 2012, respectively.
Power incurred an additional $10 million and $19 million for the three months and six months ended June 30, 2014, primarily for repairs at certain generating stations in Power's fossil fleet.
PSEG maintains insurance coverage against loss or damage to plants and certain properties, subject to certain exceptions and limitations, to the extent such property is usually insured and insurance is available at a reasonable cost.


The PSEG Suit
After failing to settle with its insurers, on June 18, 2013, Public Service Enterprise Group, a publicly traded diversified energy company and its subsidiaries, sued 11 primary and excess insurers in a New Jersey court in Essex County, seeking a declaration that the insurance policies cover their losses resulting from damage caused by Superstorm Sandy's storm surge and that their losses incurred as a result of Superstorm Sandy were caused by a "Named Windstorm" (i.e., Superstorm Sandy) and are not subject to the flood sublimits contained in the policies issued by 10 of the 11 insurers.  The case is Public Service Enterprise Group, et al. v. ACE American Ins. Co., et al., No. ESX-L4951-13, N.J. Super., Law Div., Essex Co.
PSEG contends that 11 insurers — whose policies together provide $1 billion in coverage — have suggested they are only liable for $50 million of its Sandy losses.  The insurers are relying on flood sublimits that not only cap such coverage at $250 million per occurrence but further restrict payouts to $50 million for losses in particular flood zones.
PSEG claims that apart from an excess policy that National Union Fire Insurance Co. of Pittsburgh, Pa., issued, their coverage for a "named windstorm" includes "ensuing storm surge" and doesn't define "flood" to include a storm surge.  This will be very critical for PSEG to prevail in this suit.
According to PSEG, had the defendants other than National Union intended to subject losses caused by a named windstorm's ensuing storm surge to the flood sublimits of their policies, they could have adopted language similar to that adopted by National Union, whose policy clearly states with respect to named windstorms that “ensuing flood and wind driven water damage ... shall be subject to the flood annual aggregate”.  According to the suit, there is no such language in the other policies.
Hurricane Sandy damaged huge portions of the traditional power grid, but it also wreaked havoc on some of the installations of New Jersey’s largest solar developer.  In a filing with the New Jersey Board of Public Utilities, Public Service Electric & Gas said its solar installations suffered more than $3 million worth of damage, primarily from storm surges that flooded ground-mounted solar systems, as well as wind and lightning taking their toll on rooftop arrays.


In April 2014, Following the Answer to the Complaint, PSEG revised upwards the Damages
In that lawsuit, PSEG stated that its estimate of the total costs related to damaged facilities was approximately $426 million.  Of these costs, $364 million and $62 million related to Power and PSE&G, respectively. In August 2013, the insurance carriers filed an answer in which they denied most of the allegations made in the Complaint.  Discovery is ongoing.  In April 2014, PSEG notified the insurance carriers of a revised estimate of $579 million for total costs related to damaged facilities, of which $484 million and $95 million related to Power and PSE&G, respectively.


Amtrak Wants $500M from Insurers for Sandy Coverage
On September 17, 2014, Amtrak filed suit against a number of insurers in New York federal court to recoup the total $504 million in losses the rail giant claims to have suffered from Superstorm Sandy, telling the court it has only received $30 million in compensation from the insurers thus far. The case is National Railroad Passenger Corporation v. Ace Bermuda Insurance, Ltd. et al, 1:2014cv07510, U.S. District Court for the Southern District of New York, Sept. 17, 2014.
The National Railroad Passenger Corp. told the court in its complaint that the railroad operator, known as Amtrak, informed its more than one dozen insurers in December that it suffered an estimated $504 million in losses from Sandy and submitted more than $270 million in claims.  But the insurers have only paid a token portion of that amount and have maintained that Amtrak isn’t entitled to more than $125 million under their plans, the suit says. “Amtrak seeks a declaration as to the meaning of certain policy provisions that are actively in dispute. Amtrak also seeks a judicial determination that defendants have breached their contractual obligations in connection with Amtrak's outstanding claim for losses following Superstorm Sandy,” the complaint said.  The insurers say most of the damages sustained had been induced by a flood while Amtrak says damages were brought on by the storm surge and that losses were induced by a number of occasions.


The suit lists 17 insurers as defendants, including ACE Specialty Insurance Co., Federal Insurance Co., Lexington Insurance Co., Certain Underwriters at Lloyd's of London and more. Amtrak says the insurers have contractual obligations to cover the rail operator under more than 25 first-party all-risk property insurance policies they sold to Amtrak in 2011 for substantial premiums. After Sandy made landfall in October 2012, inflicting more than $72 billion in damages across the Eastern Seaboard, Amtrak reached out to its insurers.  According to the complaint, Amtrak’s “critical physical assets” around New York City, including tunnels, bridges, track systems and power stations, had been substantially impacted by the storm.  The affected properties are “essential” to Amtrak’s operation of trains along the Northeast Corridor, the business railroad in North America, and are also essential to other commuter rail services provided by the Long Island Railroad and New Jersey Transit, the complaint says.  In addition to rail damage because of excessive flooding and gale force winds from the storm, Amtrak suffered losses from business interruption when it was forced to shut down its services for several days after the storm, the suit says. In total, it says it lost around $504 million from the storm.  The rail operator says that while it informed the insurers of the damage in a timely fashion after the storm, the insurers engaged an adjuster of their own and have forced Amtrak to facilitate inspections at its facilities.
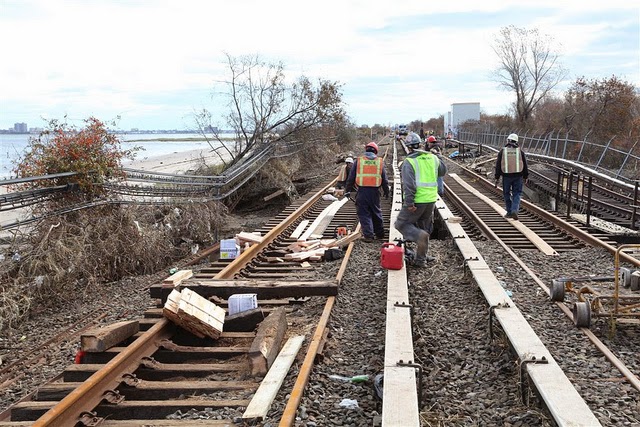

But despite Amtrak’s cooperation, it says it has been unable to recover more than “a token amount” of insurance proceeds.  Most of the insurers claim Amtrak is not entitled to receive more than $125 million under the various policies, but the “plain language of those policies calls for defendants to pay Amtrak’s claim up to the limits of each policy,” with the pre-occurrence limit set at $675 million, the complaint says.  Amtrak asked the court to declare that the insurers have breached their contracts and that the rail operator is entitled to full coverage up to the limits of each of the policies.

This Oct. 31, 2012, aerial photo shows damage from Superstorm Sandy in Mantoloking.

One Critical Issue to be decided by the Courts is whether Superstorm Sandy was a "Named Storm?"

Property insurance policies commonly contain a “Named Storm” deductible, which provides for a substantially higher deductible than other causes of loss.  For example, the policy in AFP 104 Corp. v. Columbia Casualty Company1 contained a base deductible of $10,000 and a Named Storm deductible of $1 million per occurrence.
In AFP 104 Corp., the insured claimed damages in the amount of $774,562.32 for direct property damage and time element losses related to the interruption of electrical services following the storm. The carrier denied coverage for AFP’s claim on the grounds that the total loss did not exceed the applicable Named Storm deductible of $1 million per occurrence. AFP thereafter brought suit against Columbia and Columbia filed a motion to dismiss based on the Named Storm deductible.
The policy defined “Named Storm” as:
A storm that has been declared to be a named tropical storm or hurricane by the U.S. National Weather Service or other government authority including hurricane or tropical storm spawned tornado(s) or microburst(s). The named tropical storm or hurricane ends when the National Weather Service officially declares the named tropical storm or hurricane permanently downgraded to a tropical depression.
AFP claimed that upon landfall in New Jersey, Sandy was characterized as a post-tropical storm, and thus it was not a “tropical storm or hurricane” as defined in the policy and the Named Storm deductible was never triggered.
Ultimately, the Court denied Columbia’s motion to dismiss, finding that AFP had sufficiently alleged a facially plausible claim that AFP was entitled to coverage under the policy.
While this opinion did not resolve the question of whether Superstorm Sandy was a Named Storm as defined by the policy, it did find that the insured could pursue its claim and offer evidence to show that the Named Storm deductible was wrongfully applied to its claim.
Whether a Named Storm deductible applies to a claim and how the courts decide this issue could mean the difference of thousands of dollars for insureds.


1 AFP 104 Corp. v. Columbia Casualty Co., No. 13-4077, 2014 WL 793780 (D. N.J. Feb. 26, 2014).


If the Claim Damage Estimates are Too Low for Hurricane Sandy Damages, the Insurer and the Inspector/Cost Estimator Could be Liable for Bad Faith Damages

One recent case in Louisiana sends a caution to the firms or individuals who provide flood or storm damage inspections and repair estimate about potentially significant liability for errors or omissions during the course of their investigation.
The case is SHELTER MUTUAL INSURANCE COMPANY v. RIMKUS CONSULTING GROUP, INC. OF LOUISIANA, ET AL. (Parish of Lafayette), 2013-CC-1977. 
Shelter Mutual Property Insurance Company (Shelter) retained Rimkus Consulting Group, Inc. (Rimkus) and Craig Rogers of Rimkus to provide an engineering evaluation and expert witness services in connection with its defense of litigation resulting from a claim for hurricane damages brought by a corporation (Patriot Corporation) insured by Shelter.  Rimkus sent Shelter a letter confirming the engagement and indicating Rimkus’ services were subject to its “Terms and Conditions” attached to the letter. The “Terms and Conditions” included a forum selection clause which required venue for any suits arising out of the contract to be in Harris County, Texas.  When a dispute arose, Shelter filed suit against Rimkus in the 15th Judicial District Court for the Parish of Lafayette.  Shelter essentially asserted Rimkus issued an erroneous opinion relative to the cause of the property damage and failed to properly estimate the underlying repair costs, causing Shelter to incur liability for bad faith damages and additional costs relative to further litigation.  Rogers has already conceded to Shelter, after reading a contractor’s cost estimate, that his (Rimkus/Rogers’) estimates were erroneous and that Shelter should have paid Patriot almost $554,000 instead of the original damage estimate of $143,000.  Shelter paid Patriot a bad faith settlement amount of $797,000, in addition to the original cost of $143,000.  Shelter now seeks these damages from Rimkus and Rogers.
The Supreme Court ruling only pertained to the forum selection clause, resolving a split in the circuit courts of appeal regarding whether forum selection clauses are per se violative of public policy in Louisiana.  The Court answered that question in the negative and reversed the rulings of the lower courts.
Not too long ago, there was a congressional inquiry into the changing of the results section of a flood damage report also prepared by Rimkus.  The issue appeared to be similar to the ones that have been raised by Plaintiff’s lawyers, as was detailed here:  https://sites.google.com/site/metropolitanforensics/fraudulent-superstorm-sandy-flood-expert-reports
In addition to these erroneous damage estimates, many victims of Superstorm Sandy have found that the settlement offered by their insurance company falls short of the actual costs associated with rebuilding and restoring the damages incurred.  There are several reasons for this disparity.
Most insurance carriers employ outside claims adjusters to conduct site inspections of the damaged homes, condominiums and businesses.  These outside claims adjusters are typically overwhelmed with insurance claims, so this work load may result in errors in the scope and pricing of repairs.  Another reason the settlement offered maybe short is that the software used by the insurance company to calculate the claims does not adequately reflect the reality of the actual field conditions caused by the storm.
In the past decade, there have been computer software programs used by insurers to estimate construction costs.  These programs calculate structural damage, repair and rebuilding expenses.  Unfortunately the models are based on tract housing and do not take into consideration such things as historic, custom or expensive dwellings.  Furthermore, Super Storm Sandy ravaged areas and communities comprised of high valued real estate.  As a result, the estimates produced by these software programs will most likely be insufficient to reimburse the claimant for the actual cost of rebuilding or replacing his damaged property.


Builders and contractors retained by property owners (not by insurers) do not use this type of software program to produce their estimates.  They base their cost estimates on sub-contractor bids and their general knowledge about the costs and time involved in a potential job as well as the current cost of materials found locally.
Another factor that these software programs do not take into consideration is the principal of supply and demand.  The amount of damage produced by Super Storm Sandy was cataclysmic.  As a result, contractors are inundated with requests for bids and estimates.  The demand for skilled labor far exceeds the supply, so contractors and builders are not able to compete for work.  Therefore those left to rebuild have little room to negotiate pricing, often creating a gap between the claim settlement offered by the insurance company and the actual cost of restoring and repairing their homes.
Finally, there are always the allegations of the conflicts of interest for cases where the WYO (Write Your Own) policy insurer determines the damages to itself (due to wind, wind-driven rain or other isnured peril) and the NFIP.  Key concerns raised from the Superstorm Sandy event include whether or not some property-casualty insurance claims for wind-related damages were improperly shifted to NFIP at the expense of taxpayers.  For properties subjected to both high winds and flooding, determinations must be made to assess the damages caused by wind, which may be covered through a property-casualty homeowners policy, and the damages caused by flooding, which may be covered by NFIP.  The property-casualty insurer, NFIP, and the poliholder all have a financial stake in the outcome of these determinations.  Under NFIP, most flood damage claims are adjusted by private property-casualty insurers, known as the write-your-own (WYO) insurers, which sell and service flood insurance policies on the program's behalf.  Concerns over the processing of these flood claims are heightened when the same insurance company serves as both NFIP's WYO insurer and the property-casualty (wind) insurer for a given property.  In such cases, the same company is responsible for determining damages and losses to itself and to NFIP, creating a potential conflict of interest.  Based on an audit done by FEMA personnel of the Superstorm Sandy and other storm property assessments regarding the proper allocation of wind versus flood damages, there is no evidence that such situation exists.


Metropolitan Engineering, Consulting & Forensics (MECF)
Providing Competent, Expert and Objective Investigative Engineering and Consulting Services
P.O. Box 520
Tenafly, NJ 07670-0520
Tel.: (973) 897-8162
Fax: (973) 810-0440
We are happy to announce the launch of our twitter account.  Please make sure to follow us at @MetropForensics or @metroforensics1
Metropolitan appreciates your business.
Feel free to recommend our services to your friends and colleagues.


[1] New Jersey Transit Corporation v. Certain Underwriters at Lloyd’s Hudson Specialty Insurance Co. Ironshore Specialty Insurance coverage Co. Maiden Specialty Insurance coverage Co. RSUI Indemnity Co. Torus Specialty Insurance coverage Co. and Westport Insurance Corp. Superior Court of New Jersey Law Division, Essex County, Oct. 1, 2014.

Wednesday, October 8, 2014

FIRE CAUSE & ORIGIN INVESTIGATIONS: LACK OF SCIENCE IS BEHIND MANY ARSON C&O INVESTIGATIONS


LACK OF SCIENCE IS BEHIND MANY ARSON CAUSE AND ORIGIN INVESTIGATIONS


Arson investigation, unfortunately, is a field where junk science has been the rule rather than the exception.  A large body of cause-and-effect mythology has developed in fire investigations over the years.  As far back as 30 years ago we have been arguing that the opinions stated by many fire investigators were not based on science and they were in fact false.  Due to these faulty opinions, many people were convicted of arson and many people lost their home and their livelihood.  Some people have allegedly been put to death having been convicted of arson, based on the same old cause-and-effect mythology.  

Through the 1980s, proponents (including ourselves) of a science-based approach to arson investigations waged an uphill battle, finally winning a major victory in 1992 when the National Fire Protection Association (NFPA) published its Guide for Fire and Explosion Investigations (NFPA 921).  NFPA 921 would subsequently become the bible in fire and arson investigations.
Prior to NFPA 921, the fundamental principles for determining the causes of fires did not involve science per se, but rather experience-based hypotheses that were not tested to determine their validity.  This process, known as “negative corpus,” relied on a process of elimination rather than supporting evidence or scientifically supported conclusions, and some investigators feared that a science-based approach would establish criteria of proof that would be too difficult to meet.  So, they fought NFPA 921.
The Daubert v. Merrell Dow Pharmaceuticals decision was handed down in 1993, where the U.S. Supreme Court made judges the gatekeepers of expert testimony.  The ruling said that judges have to determine if expert testimony is reliable, and that using a methodology that has been peer reviewed, published, and accepted was part of that reliability test.  So in cases that included fire investigations, courts began gravitating towards NFPA 921, a consensus document from a group of leaders in the fire investigation community.  The U.S. courts began referring to NFPA 921 as the “standard of care” for evaluating expert testimony regarding fire investigations.
An organization called the Innocence Project [which works to exonerate the wrongfully convicted] has taken an interest in arson cases.  They are going back and evaluating the science or lack thereof in investigations and comparing it with what’s available today.  They estimate that between 200 and 400 individuals may have been wrongly convicted of arson based on false evidence and false expert testimony using non-scientific methods.
We are also very gratified to see state legislatures now trying to reverse some of the wrongs committed over the years as a result of these false opinions and wrongful convictions.  In this blog lack of validity of common myths is reviewed, and new forensic engineering analysis techniques discussed consistent with the NFPA 921.
The COMM. ON IDENTIFYING THE NEEDS OF THE FORENSIC SCI. CMTY. ET AL., published the report entitled NAT’L RESEARCH COUNCIL OF THE NAT’L ACADS.,STRENGTHENING FORENSIC SCIENCE IN THE UNITED STATES: A PATH FORWARD (2009).  Therein, the report stated the following regarding the fire investigations:

By contrast, much more research is needed on the natural variability of burn patterns and damage characteristics and how they are affected by the presence of various accelerants. Despite the paucity of research, some arson investigators continue to make determinations about whether or not a particular fire was set.  However, according to testimony presented to the committee,[1] many of the rules of thumb that are typically assumed to indicate that an accelerant was used (e.g., “alligatoring” of wood, specific char patterns) have been shown not to be true.[2] Experiments should be designed to put arson investigations on a more solid scientific footing.
In the early 1990’s, fire investigators relied heavily upon the teachings of their mentors regarding the nuances involved in interpreting incendiary indicators.  Access to controlled burn experiments and other practical guidance regarding the science of fire behavior was limited.  At the national level, the NAS Report notes the prevalence of apprenticeship training across forensic disciplines, finding that reliance on “apprentice-type training” and a “guild-like structure” works against predictability. (NAS Report at 15-16.) Similarly, the knowledge levels on which fire investigation practices were based at the time were “extremely variable” due to the “one-on-one training that dominated.”  While scientific papers and textbooks describing some of the “modern” fire science principles existed in the early 1990’s, it is difficult to determine how widely those materials were disseminated, or whether they were understood and accepted by fire investigators at the time.
Perceived Gap in Understanding Between Fire Scientists and Fire Investigators
Many are concerned about perceived differences in understanding of fire indicators between the scientists and engineers who study principles underlying fire indicators, and the state and local professionals who respond to and investigate fires.  One challenge is the lack of science education on the part of many fire investigators.  Though this dynamic is changing as younger classes of investigators gain exposure to college coursework in chemistry and physics, most active investigators do not have scientific backgrounds.
Elimination of Accidental Causes
A critical component of successful fire investigation is the elimination of accidental causes.  The elimination of any single cause requires an investigator to use his or her judgment, and to request outside assistance when necessary.  For example, when considering whether a child could have set the fire in a case, investigators may conclude that the possibility was remote considering the ages of the children, the fact that no lighters were found near them and that a child’s gate blocked the bedroom doorway.  This is the sort of judgment that fire investigators typically must engage in during the course of an investigation.  Investigators would be required to make a similar judgment call today if the same facts were presented.
However, other components of assessing accidental causes have been assisted by developments in science and engineering over the last two decades.  For example, scientists and engineers have created methods that allow investigators to conduct a more thorough review of possible electrical malfunction as a point of origin.  In the early 1990’s, investigators routinely checked for shorts in the line after “pulling” the electrical meter for the safety of those on the scene, in accordance with the safety requirements of NFPA 921. (See NFPA 921, 1995 edition at 10-2.4.)  If there were no shorts in the line and no evidence of appliance malfunction, investigators concluded that the cause was not attributable to electrical malfunction.

Today’s investigators have additional tools at their disposal. For example, investigators can use the process of arc mapping (See 2011 edition of NFPA 921) to determine a fire’s possible point of origin.  Many local investigators are aware of the arc mapping process and often consult electrical engineers for assistance.
Pattern Indicators
As previously stated, the value of various incendiary indicators and the manner in which they are identified has changed since the early 1990’s.  Experts have identified indicators that were present in the Texas arson cases of Willingham (who was executed in 2004) and Willis (who was freed in 2004) that have since undergone extensive scientific testing and experimentation.  Such testing has provided scientists with a better understanding of the limitations of the indicators.  Many of these indicators may be present in arson cases where accelerants are used, thus requiring an investigator to use the scientific method as expressed in NFPA 921 to conduct a systematic review.  The discussion below does not examine every indicator used in the fire investigators’ reports but rather includes illustrative examples applicable to all arson cases.  Excerpts from fire scene reports and trial testimony, though inherently incomplete, provide a sense of the investigators’ understanding of incendiary indicators at the time of trial.  The question of when, why and how certain limitations should be applied to incendiary indicators is the subject of ongoing study by the fire science community.

The classic V thermal damage pattern is used by analysts to determine the origin of the fire, the base of the V being the likely origin of the fire

1.    V-Pattern as Indicator of Origin

                                               Family room V-Pattern

A Fire Marshal’s report discusses “V-patterns” as an indicator of fire origin.  The report states:
The burn pattern on the east and west wall of the hallway disclosed a gradual climb in a 45 degree angle toward the south end and clearly showed a “V” pattern.  This “V” pattern is an indicator that the fire originated on the floor near the north end.  The north end area of the floor disclosed that the fire had burned through the tile blocks and caused charring of the wooden floor underneath.  The burn pattern on the floor and “V” burn patterns on the walls is an indication that a fire originated at the north end area of the center hallway.
The Fire Marshal also testified regarding “V” patterns as follows:
The photograph that sees the V pattern debris, that’s Exhibit No. 23. The one that tells where the V is, that’s possible origin of the fire.

In the early 1990’s, many fire investigators based their conclusions of origin in part on the theory that a “V-pattern” on a wall points to the origin of the fire.  For example, the 1995 edition of NFPA 921 4-17.1 stated: “the angled lines of demarcation, which produce the “V” pattern, can often be traced back, from the higher to lower levels, toward a point of origin.  The low point or vertex of the “V” may often indicate the point of origin.” NFPA 4-17.1 (1995 edition).
Scientists now know that the “V-pattern” simply points to where something was burning at some stage of the fire, not necessarily the origin.

V pattern suggests a fire origin at the red arrow in the vicinity of a stove top. There is some drop down burning debris as shown by the green arrow.

2.    Pour Patterns
A Fire Marshal testified as follows regarding his interpretation of pour patterns in the home he investigated:
So this area right here are what I call burn trailers. Burn trailers is like a trailer, you know, like a little path, a burnt path.  A pour pattern, which is a pattern like somebody put some liquid on the floor or wherever and, of course, when you pour liquid, then it creates a puddle.  Liquid creates puddles. When it rains you get puddles.  When the baby drops its milk, you create puddles.  If you ever drop a coke, you create puddles.  All this area has that, has the burn trailer pour patterns and configurations. This area right here, which is right here almost in front of this bed is deep charred.  The floor, it didn’t burn through the floor, but it burned the three layers of the floor.  And a pour pattern and trailer is an indication that somebody poured something, you know, either going in or out.

All fire goes up. All water goes down. Or any liquid goes down unless man changes the course.
Another Fire Investigator also testified regarding his interpretation of pour patterns in another case:
It appears to be burned areas resembling how a liquid would have run and burned on that surface. (Answer in response to a question regarding irregular floor patterns.)

“I have never run across that, no, sir.” (In response to the following question: “Now, in your experience, training, and your reading publications to keep up-to-date, have you or have you not heard of the phenomenon that radiation can cause irregular patterns?”)

“That’s correct.” (In response to counsel’s assertion that “fire burns up, not down.

In the early 1990’s, many fire investigators reasoned that fire moves upward (at least flames and hot gases do) and that carpet and flooring is difficult to ignite.  If one pours ignitable liquid on a floor, the carpet burns away in an irregular path similar to the deposits of the liquid.  Thus, it was often thought that pour patterns at floor level were “nearly proof alone” that the fire was started with an accelerant.  While such a fire could have been started with an accelerant (see e.g., NFPA 921 1995 edition, 4-17.7.2) other phenomena of fire behavior can also cause similar pour-like patterns.
For example, when a fire approaches or surpasses flashover conditions, all of the exposed carpet in the room will ignite.  Synthetic carpets and pads melt or decompose to liquid as they burn, producing highly irregular and unpredictable patterns.  The effect of ventilation conditions, radiant heat, flaming and smoldering debris, and drop-down burning from things like synthetic mattresses and bedding also affect the irregular burn patterns.
The term pour pattern implies that a liquid has been poured or otherwise distributed, and
therefore, is demonstrative of an intentional act. Because fire patterns resulting from burning ignitable liquids are not visually unique, the use of the term pour pattern and reference to the nature of the pattern should be avoided. The correct term for this fire pattern is an irregularly shaped fire pattern.
The presence of an ignitable liquid should be confirmed by laboratory analysis. The determination of the nature of an irregular pattern should not be made by visual interpretation of the pattern alone. See Figures below for examples of fire patterns on floors.


Fire Patterns on Floor Resulting from Fully Developed (Post-Flashover) Fire in Full Scale Test Burn of Residential Structure. Floor Was Carpeted and Room Had Typical Residential Furnishings; No Ignitible Liquids Were Present.


Fire Patterns on Linoleum Floor Resulting from Fully Developed (Post-Flashover) Fire in Full-Scale Test Burn of Residential Structure; No Ignitible Liquids Were Present.

    Holes in the floor may be caused by glowing combustion, radiation or an ignitable liquid.
    There is no justification that the appearance of large, curved blisters is an exclusive indicator of an accelerated fire.
    The presence or absence of spalling should not, in and of itself, be construed as an indicator of the presence or absence of a liquid fuel accelerant.
    Inverted cone patterns have been interpreted as proof of flammable liquid fires, but any fuel source that produced flame zones that do not become vertically restricted can produce inverted cone patterns.


Today, fire scientists and investigators should have a better understanding of the nuances of flashover conditions, including how to analyze their effects.  Rigorous, ongoing training is the key to ensuring that all investigators are knowledgeable about developments in the scientific community’s understanding of the complex chemical and physical phenomena involved in fires, including but not limited to the effects of flashover.

3.    Low/Deep Burning and Multiple Separate Points of Origin
A Fire Marshal testified as follows regarding his interpretation of low/deep burning and multiple separate points of origin:

And you got char burning, like for example, this is the bottom here.  It’s burned down here at the bottom.  That is an indicator in my investigation of an origin of fire because it’s the lowest part of the fire.

Multiple areas of origin indicate—especially if there is no connecting path, that they were intentionally set by human hands.

The first incendiary indicator is the auto ventilation. The inconsistency of the fire going out of this window and the fire going out of the door and this window here.  That’s inconsistent with fire behavior. That’s an indicator that it’s a possible incendiary fire.  Okay.  Puddle configurations, pour patterns, low char burning, charred floor, the underneath burning of the baseboard, the brown stains on the concrete, the underneath of the bed, because of the fire right underneath the bed, puddle configurations in that area, and the total saturation of this floor is indicated with pour patterns, because that’s all I’m doing is looking at the facts, at the evidence.

A Fire Investigator noted low burn as a significant indicator in another case as follows:

Initially, when we had finished the view of the exterior of the building and walked into the inside of the structure, there were a couple of things that caught our attention right off. First of all, the low burning on the walls almost to floor level.

The most highly significant would be the low burning to the floor level on some of the walls, and the burn patterns that I observed on the floor itself.

In my opinion, there was some type of flammable liquid applied there.  There was no other fuel source there that would have indicated it would have burned in that manner.

Low burn patterns may be an indicator of accelerant, but scientific experiments have also shown that radiant heat transfer causes low burn patterns, and that the radiant heat of a fully involved room fire can be sustained to penetrate floors deeply.  Scientific testing has also shown that ignitable liquids alone do not burn long enough to penetrate floors deeply.  Similarly, the appearance of multiple separate points of origin may provide evidence that a fire was intentionally set, but is often attributable to radiation and drop down effects.


Burn Patterns on a Floor of a Room Burned in a Test Fire in Which No Ignitable Liquids Were Used

 Configuration is also of critical importance when determining area of origin.  For example, fall down of something like curtains could cause an area of low burning.  That’s not an area of origin, but it can easily be mistaken for one or be taken as ‘evidence’ of multiple fires.  Another fire effect that can cause low burning is radiant line of sight, which is responsible for 1/3 of the heat of a fire

Typically, the difficulty with burn pattern interpretation happens when there is a strong factor that tips the fire dynamics physics in a different direction that might “naturally” occur.  An open door at the end of the hall can affect the ventilation of the fire, possibly pulling it away from the true area of origin to more heavily damage the area near the ventilation source.  Once ignited by radiant heat or flame impingement, an unusually heavy fuel load in one part of the room can cause greater damage than less loaded areas.  The good news is that these conditions can be observed at the scene and their effect included in the fire flow analysis.  But, the investigator must look for them and actively analyze their potential effects, not blindly go by the adage of “least to most, lowest part, there’s your area of origin.”
And then, there’s the postflashover scene.  When a fire proceeds through flashover and into the full room involvement phase, the chaotic air flow and “firestorm”-like conditions can alter, obscure, or obliterate the original fire patterns, as well as cause unusual physical damage.  The full room involvement stage typically produces heat flux readings at floor level of 170 kW/m2, which is sufficient to ignite most floor coverings and construction materials, creating extensive areas of low burning that may or may not be proximate to the area of origin.  Full room involvement can burn exposed wood on floors, window sills, and baseboards, even taking advantage of small gaps in wall construction to draw in air that causes ventilation effects.
Some of these potential postflashover effects mimic effects that can be caused by ignitable liquids, such as curling of vinyl floor tile and spalling of concrete.  Anytime a room reaches flashover, concrete will spall.  Unusual effects, like charring of the undersides of furniture, burning of floor coverings under furniture, burning under doors, and burning holes in floors have been observed with full room involvement fires.  The myth that effects like burning under furniture can only be caused when an accelerant is poured under the furniture does not hold true when everything in the room is on fire.  In a postflashover fire, the turbulent mixing between combustion gases and fresh air being drawn into the room causes high and variable heat fluxes that can cause irregular damage to floors and floor coverings.  They can also cause more intense burning around ventilation openings and melt synthetic fabrics and carpets.  In fact, in a post-flashover fire, the fire becomes ventilation-controlled and the most intense fire, and therefore the most intense thermal damage, may be near the air supply, such as open windows or doors.  Ventilation-controlled fires can, near ventilation sources, produce the characteristic V-pattern that is typically seen as an indication of fire origin.  In a ventilation-controlled fire, if a V-pattern is found near a door, for example, the investigator must consider whether this might have been an effect of the postflashover burning, rather than an area of origin. As these effects show, flashover makes the determination of the first material ignited much more difficult, as heavy burning may now occur in many places.
In summary, The key in tracing fire flow and finding the area of origin is, in reality, far more complex than the myth of most damage and lowest burning.  The investigator must observe and take into account all the physical properties of the compartment, including ventilation, fuel load, configuration, the stage of the fire (and whether or not flashover was achieved)—and the interaction between all of these factors plus the unique characteristics of that environment.

Today, fire scientists and investigators should have a better understanding of the nuances of low burn and deep burn patterns, as well as the various factors that create the appearance of separate multiple points of origin.  Continuous, targeted education regarding these indicators will ensure that investigators understand and effectively analyze the extent to which patterns are attributable to accelerant and/or other factors.
4.    Spalling
A Fire Marshal report includes an assessment of spalling evidence as follows:

The examination of the porch concrete floor disclosed an area of brown discoloration at the base of the north wall and in front of the door to the central hallway. This discoloration, or brown condition, is also an indication that a liquid accelerant burned on the concrete.

Spalling (i.e., brown discoloration or chipping or pitting of concrete or masonry surfaces) occurs when concrete, masonry or brick is exposed to a high rate of heating by flame or high levels of radiation from fuel.  Spalling is characterized by the loss of surface material resulting in cracking, breaking, and chipping or in the formation of craters on concrete, masonry, rock, or brick.  Fire-related spalling is the breakdown in surface tensile strength of material caused by changes in temperature, resulting in additional mechanical forces within the material. 


                                Concrete spalling above a doorway caused by fire

A mechanism of spalling is the expansion or contraction of the surface while the rest of the mass expands or contracts at a different rate; one example is the rapid cooling of a heated material by water.  Spalled areas may appear lighter in color than adjacent areas.  This lightening can be caused by exposure of clean subsurface material. Adjacent areas may also tend to be darkened by smoke deposition.  Another factor in the spalling of concrete is the loading and stress in the material at the time of the fire. Because these high-stress or high-load areas may not be related to the fire location, spalling of concrete on the underside of ceilings or beams may not be directly over the origin of the fire.

Controlled laboratory experiments have shown that while spalling may be caused by burning accelerant, it is more often caused by sustained heat from other sources.  It is critical that today’s investigators understand how to properly analyze spalling evidence.  For example, investigators should identify appropriate samples of adjacent materials and send those materials for laboratory testing to determine whether accelerant is present.

The presence of spalling at a fire scene cannot be taken as a definitive indicator that an accelerant was used in the fire.  Rather, the presence of the spalling should be explained, if possible, and then treated as one of many factors that enter into assessing the totality of the circumstances at the scene and their relationship to determining the heat source and first material ignited.


5.    Fire and Burn Intensity


                             Pulled bulb, showing that the heat was from the right


A Fire Marshal Vasquez testified as follows regarding his interpretation of burn intensity:

And aluminum melts at 1200 degrees normal. Wood fire does not exceed 800 degrees. So to me, when aluminum melts, it shows me that it has had a lot of intense heat. It reacts to it. That means its temperature is hot. The temperature cannot react. Therefore, the only thing that can cause that to react is an accelerant. You know, it makes the fire hotter. It’s not normal fire.
So when I found that the floor is hotter than the ceiling, that’s backwards, upside down. It shouldn’t be like that. The only reason that the floor is hotter is because there was an accelerant. That’s the difference. Man made it hotter or woman or whatever. Human being made it hotter.
The fire, itself, tells me that it’s a very aggressive fire; and, therefore, the fire was not a planned fire. It was a spur-of-the-moment fire.

Wood and gasoline burn at essentially the same flame temperature.  In the early 1990’s, the “widely held belief” among fire investigators was that the flames of a wood-fueled fire are cooler than those fueled by petroleum products.  Thus, investigators would often conclude that a “hot fire” must have had an accelerant ignition.  Scientists now know that flame temperatures for normal fuels against liquid fuels are similar, and compartment temperatures alone cannot be used to distinguish whether ordinary or liquid fuels were involved.  It is critical that today’s fire investigators understand the significance of flame temperature and heat release rates, and how these factors should be viewed within the context of other indicators.
If the investigator knows the approximate temperature required to produce an effect, such as melting, color change, or deformation a material, an estimate can be made of the temperature to which the material was raised.  This knowledge may assist in evaluating the intensity and duration of the heating, the extent of heat flow, or the relative rates of heat release from fuels.  When using materials such as glass, plastics, and white pot metals for estimating temperature, the investigator is cautioned that there is a wide variety of material properties for these generic materials.  The best method for utilizing such materials as temperature indicators is to take a sample of the material and have its properties ascertained by a competent laboratory, materials scientist, or metallurgist.
In addition to the wood and gasoline burning at essentially the same flame temperature, the turbulent diffusion flame temperatures of all hydrocarbon fuels (plastics and ignitable liquids) and cellulosic fuels are approximately the same, although the fuels release heat at different rates. Burning metals and highly exothermic chemical reactions can produce temperatures significantly higher than those created by hydrocarbon- or cellulosic-fueled fires.
In summary, fire patterns are generated by one of two mechanisms: the spread of the fire or the intensity of burning.  As discussed above, fuel composition, rate of heat release, location, and ventilation differences may lead to differences in the intensity patterns that do not necessarily point to the area where the first fuel was ignited.  Patterns that arise from the growth and movement (spread) of the fire are invariably better indicators of the area of origin.  It may be difficult, however, to distinguish movement patterns from intensity patterns.  Further, some patterns display a combination of intensity and movement (spread)
indicators.

          Holes in the floor may be caused by glowing combustion, radiation or an ignitable liquid.
          There is no justification that the appearance of large, curved blisters is an exclusive indicator of an accelerated fire.
          The presence or absence of spalling should not, in and of itself, be construed as an indicator of the presence or absence of a liquid fuel accelerant.
          Inverted cone patterns have been interpreted as proof of flammable liquid fires, but any fuel source that produced flame zones that do not become vertically restricted can produce inverted cone patterns.


6.    Crazed Glass


                         Crazing of glass in a fire where no accelerants were used

Crazing is a term used in the fire investigation community to describe a complicated pattern of short cracks in glass.  A Fire Marshal made the following statement regarding crazed glass in his report in an arson case:

The pieces of broken window glass on the ledge of the north windows to the northeast bedroom disclosed a crazed ‘spider webbing’ condition. This condition is an indication that the fire burned fast and hot.

Crazing is the result of the rapid cooling of glass in a hot environment by the application of water spray.  Fire scientists and investigators have concluded that it no longer has any value as an indicator.  Today’s investigators should not mention the presence of crazed glass in a fire scene report.  If crazed glass were mentioned, corrective action would be taken immediately.
Incendiary indicators, including but not limited to those discussed above, are subject to numerous variables that require continuous study and evaluation.  Scientific understanding of the indicators has continued to advance as additional experiments are conducted. Training must ensure that fire investigators clearly understand all incendiary indicators and their limitations, including the possible effects of phenomena such as flashover and associated radiation, ventilation, smoldering debris and drop-down effects.  Whatever training is provided must include an environment in which investigators and scientists are free to exchange information and engage in honest and open dialogue regarding fire behavior and incendiary indicators.

Confirmation of Accelerant Through Laboratory Testing
In one arson case, ten samples were sent for testing. None of the samples tested positive for accelerant.   In another case, an unspecified number of samples were sent for testing, and one (under the aluminum threshold of the front door) tested positive for accelerant.
At the time these cases occurred, positive laboratory results were accepted if they were available, but they were not considered necessary to reach the conclusion that the fire involved intentional use of an accelerant.
As technology advanced, fire scientists and investigators developed a better understanding of the importance of confirmatory testing. Experts have also noted that technology used in gas chromatography/mass spectrometry and other laboratory testing is more sensitive today than it was in the early 1990’s. As a result, laboratory tests are better able to detect evidence of accelerant than they were two decades ago. Due to the passage of time, re-testing of samples taken in the Willis and Willingham cases is not an option.


Laboratory testing is relied upon more heavily today due to improvements in technology and enhanced expectations of lawyers and judges. Fire investigators should have a thorough understanding of the importance of laboratory testing as a tool for confirming the theory of a case, especially where arson is suspected.

The Five Most Common Arson Myths
1.  The lowest and deepest charring indicates the point of origin in a fully involved room.
2.  In a fully involved room, an experienced investigator can identify patterns produced by ignitable liquids on the basis of visual observation alone.
When a fire breaks out, a phenomenon called flashover can occur. Flashover is a transition point at which heat causes almost everything in a room to catch fire. When it happens, the natural patterns of the fire can be obscured or destroyed. V-shaped burn patterns, which often occur after a flashover, can be misinterpreted to indicate arson.
3.  Flammable liquids burn at a higher temperature than ordinary combustibles.
It's a common misconception that gasoline burns at a higher temperature than wood.  It's actually the amount of ventilation that determines the temperature of the fire, not the nature of the fuel.
4.  Spalling or flaking of concrete, especially in a "puddle" shape, is an indicator of the presence of burning ignitable liquids.
Fire tests have shown that "puddle" shapes can occur after a flashover.
5.  Heat rises and fire always burns upward. Floor level burning is therefore an indication of an incendiary fire.
The idea that a fire will not burn downward unless it has "help" is a simplistic explanation of fire behavior that doesn't take into account the flashover phenomenon. It was widely believed that burning on the floor, particularly under furniture, indicated an origin on the floor, and pointed toward arson.

Additional Myths Still in Favor in Some Quarters Today
6.  Multiple low burns, or multiple V-shaped burn patterns, even if they are burned together, indicate multiple origins.
7.  Using models, it is possible to calculate fire behavior precisely.
8.  A narrow V-pattern indicates a rapidly burning fire, whereas a wide V-pattern indicates a "normal" fire.
9.  Although flashover and full room involvement can generate ambiguous patterns, flashover is rare. (Flashover is a transition point at which you go from having a fire in a room to a room on fire).
10.         A melted aluminum threshold is unusual in a "normal" fire, and tends to indicate the presence of ignitable liquids.

Myths That Have Been Largely Discredited, And Are Only Used By Those Profoundly Unaware Of The Science
1.  "Crazed" glass, broken throughout, indicates that the glass was rapidly heated. Further, the size of the crazing can provide information about the origin.
2.  The size and appearance of char blisters can provide information about what was burning, and how rapidly it was burning.
3.  An unconfirmed canine alert constitutes valid evidence of an accelerant.
4.  The temperature of a fire follows a "standard time-temperature curve."
5.  The heat release rate of a fire can be predicted by knowing the weight of combustible fuels in a room.

Metropolitan Engineering, Consulting & Forensics (MECF)
Providing Competent, Expert and Objective Investigative Engineering and Consulting Services
P.O. Box 520
Tenafly, NJ 07670-0520
Tel.: (973) 897-8162
Fax: (973) 810-0440

http://metroforensics.blogspot.com/

We are happy to announce the launch of our twitter account.  Please make sure to follow us at @MetropForensics or @metroforensics1

Metropolitan appreciates your business.
Feel free to recommend our services to your friends and colleagues.


[1] J. Lentini. Scientific Fire Analysis, LLC. Presentation to the committee. April 23, 2007. Available at www7.nationalacademies.org/stl/April%20Forensic%20Lentini.pdf.
[2] NFPA 921 Guide for Explosion and Fire Investigations, 2008 Edition. Quincy, MA: National Fire Protection Association.