


Shhh! America's most common workplace injury is hearing loss
Zhai Yun Tan, Kaiser Health News 7:07 p.m. EDT September 1, 2016
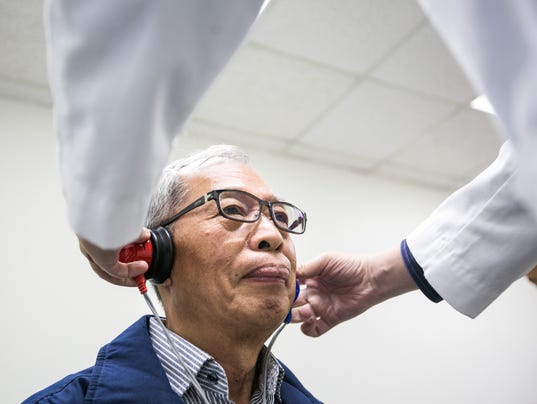
(Photo: Marcus Yam, LA Times via Getty Images)
Eight years ago, Jeff Ammon, now 55, began noticing a feeling of pressure in his ears every day after work.
Over the next months, when his symptoms progressed into a slight loss of hearing and sensitivity to noise, he became worried. Ammon, a construction worker for 32 years, eventually started wearing ear protection hoping this would address these complaints – but it was too late.
From that point on, sounds ranging from the hum of a lawnmower to normal tones of conversation caused a piercing, jabbing pain in his inner ear. He stopped working in 2011, when the pain became unbearable. He also hears ringing in his ears and experiences dizziness, both side effects of the auditory damage.
“It’s debilitating … completely,” he said.
Ammon spent almost all of his working life surrounded by the loud noises of jackhammers, saws and air compressors. Now he avoids going outdoors, choosing instead to stay in his soundproof basement in Lebanon, Pa., and communicate with his doctor mostly through an online patient portal.
“The medication to address pain has not been very successful at all. … I’m also on some medication for stress, anxiety and depression,” he said. “It has isolated me from society.”
Ammon is not alone in suffering from workplace-related hearing loss. In fact, according to the Centers for Disease Control and Prevention, it is the most common work-related injury with approximately 22 million workers exposed annually to hazardous levels of occupational noise. Workers in the mining sector, followed by those in construction and manufacturing, are most likely to suffer from hearing impairment. An estimated $242 million is spent on worker’s compensation annually for hearing loss disability, according to the Department of Labor.
In an effort to reduce these numbers, the Labor Department launched a challenge earlier this summer called “Hear and Now,” in which it is soliciting pitches for innovative ideas and technology to better alert workers of hazardous noise levels.
But critics say that while these efforts might help, technology to reduce hearing injuries already exists. They contend that the maximum level of noise exposure allowed before employers are required to provide sound-protection equipment is too low, and the regulations developed by the Occupational Safety and Health Administration are outdated. For example, those regulations use sound level limits that don’t factor in the noise exposures that occur beyond the workplace – at restaurants, concerts and sporting venues, for instance – that can add to workers’ cumulative risks of harm.
According to OSHA officials, the agency will issue a request for information later this year about current regulations at construction sites to figure out if more stringent protections are needed and how companies are complying. (The construction industry has often been held to separate noise-related rules and requirements than those in place for other industries.) The review may lead to an update to these rules, most of which date back to the 1970s. A similar call for information was issued in 2002, but no changes resulted from the action.
Employers may also have to shoulder the responsibility of instilling more awareness and education among their workers. For example, workers sometimes choose not to wear hearing protection at work sites because they are not aware of their risks – especially when they are not operating loud equipment.
Mark Cullen, a professor at Stanford University who explores workplace hazards, found in a study that the employees who suffer most from hearing loss were those who were working in jobs involving moderate noise levels instead of high-noise environments.
“At very high noise exposures, people very faithfully wear hearing protection and at low noise situations, people don’t,” he said.
For general industry workers who are exposed to noise for eight hours a day at or above a time-weighted average of 85 decibels, OSHA requires employers to provide notification, audiometric testing and free hearing protectors. Employers also have to offer training programs for affected workers. The limit is 90 decibels for an eight-hour exposure for construction industry workers.
Cullen said employers could build noise barriers or eliminate noisy equipment, but old factories often choose to just offer hearing protection gear.
“But the problem with hearing protections is it is way too easy, unsupervised, to take it off,” he said. “What would really make a difference is to train employers.”
He said there is also existing technology that will measure noise exposure in real time in each worker’s hearing protection gear, with lights that will flash when the level becomes hazardous. The data can be downloaded each day to monitor daily exposures.
Theresa Schulz, hearing conservation manager at Honeywell Safety Products, said many companies, including hers, already have such products. While she sees more large employers expressing interest in these technologies, the cost might be a deterrent for others.
“But when you think about it … the cost of having these electronics to protect the workers is nothing compared to the damage after that,” she said.
Meanwhile, the CDC, as part of its Buy Quiet campaign has an online database of power tools with information about sound levels of different tools to encourage businesses to invest in quieter tools and machinery.
Ammon worked for several small construction companies building houses. He said he was never told to wear ear protection. His colleagues didn’t wear it either. No one talked about it and, even when he worked with loud equipment, he wasn’t aware of the need for it.
“It costs money. That’s my opinion on why it’s gotten as bad as it has, at least for small construction companies,” Ammon said, and the rules are “just not enforced.”
Some of the steps taken by the federal government to move toward tightening regulations and increasing awareness suggest this might be changing. But in the meantime, people like Ammon, who feel disabled by their condition, might face difficulties in getting recognition for their symptoms and financial support.
He applied for Social Security disability benefits but was rejected because his condition was not on the Social Security Administration’s list of medical diseases considered disabling. When he first experienced his symptoms, he visited dozens of audiologists who only told him he had slight hearing loss. Research linking hyperacusis – unusual tolerance toward ordinary sounds – and pain was only at its infancy. Specific treatments still are not available for people with this type of hearing damage.
These days, he experiments with new medications or therapies, hoping for more awareness about the illness – and about protecting hearing at the workplace. He is waiting for the third appeal for Social Security disability benefits.
“I’m hearing a little more about it, but not nearly enough,” he said. “And it needs to start at the workplace.”
================
Hearing loss prevalent in oil and gas workers: WorkSafeBC
 Photo by Pixabay
It is also calling for vigilant monitoring to determine where and when the highest levels of noise exposure are occurring and to take appropriate engineering control measures to reduce exposures.
The WorkSafe bulletin issued this week is based on 2014 hearing test results, and says overall, more than one-third of the workers in the oil and gas industry showed signs of noise-related hearing loss– and specifically, more than 36 pe rcent of workers in the drilling subsector were victims.
Fort St. John WorksSafe BC Regional Prevention Manager, Budd Phillips, says the test results for oil and gas workers also showed hearing loss more than double those for other industries with hazardous noise levels.
In calling for the oil and gas industry to ensure the health and safety of its workers and prevent noise-related hearing loss injuries, WorkSafeBC also claims to have data indicating hearing protection used in the industry is in some cases insufficient and needs to be re-evaluated by employers.
It claims that 27 per cent of young workers in the oil and gas field servicing sub-sector report they don’t wear hearing protection devices.
=================
Hearing Impairment Among Noise-Exposed Workers — United States, 2003–2012
Weekly / April 22, 2016 / 65(15);389–394
Summary
What is already known about this topic?Hearing loss is prevalent in the United States, especially among noise-exposed workers.What is added by this report?This is the first known study to quantify the disability-adjusted life years attributable to hearing impairment for noise-exposed U.S. workers, and to estimate the prevalence at each level of hearing impairment by industry sector.
What are the implications for public health practice?Prevention, early detection, and intervention to preclude additional hearing loss are essential to reducing worker disability caused by hearing impairment.
Hearing
loss is the third most common chronic physical condition in the United
States, and is more prevalent than diabetes or cancer (1). Occupational hearing loss, primarily caused by high noise exposure, is the most common U.S. work-related illness (2). Approximately 22 million U.S. workers are exposed to hazardous occupational noise (3).
CDC compared the prevalence of hearing impairment within nine U.S.
industry sectors using 1,413,789 noise-exposed worker audiograms from
CDC’s National Institute for Occupational Safety and Health (NIOSH)
Occupational Hearing Loss Surveillance Project (4). CDC estimated
the prevalence at six hearing impairment levels, measured in the better
ear, and the impact on quality of life expressed as annual
disability-adjusted life years (DALYs), as defined by the 2013 Global
Burden of Disease (GBD) Study (5). The mining sector had the
highest prevalence of workers with any hearing impairment, and with
moderate or worse impairment, followed by the construction and
manufacturing sectors. Hearing loss prevention, and early detection and
intervention to avoid additional hearing loss, are critical to preserve
worker quality of life.
The NIOSH Occupational Hearing Loss Surveillance Project collects de-identified audiograms* for U.S. workers (4) who were tested to comply with regulatory requirements because of high occupational noise exposure, defined as ≥85 decibels on the A-scale (dBA).† Audiometric service providers and others that perform worker testing agreed to share these data with NIOSH. A cross-sectional retrospective cohort analysis was conducted using the last audiogram completed for each worker during 2003–2012. Audiograms missing necessary fields or with other quality issues, having hearing threshold values that suggested testing errors, or displaying attributes unlikely to be primarily caused by occupational exposures, were excluded (4). Industries were classified using the 2007 North American Industry Classification System.§
The prevalences of six severity levels of hearing impairment were calculated for workers in each industry sector using the audiometric definitions from the GBD Study (Table 1) (5), except that workers in this sample who had hearing aids did not wear them during testing. DALYs representing the number of healthy years lost per 1,000 workers each year were calculated by industry sector using the GBD Study disability weights (Table 1).¶ Tinnitus information required to calculate the DALYs was not available in the NIOSH Occupational Hearing Loss Surveillance Project sample and was estimated using results from previous studies (6,7).**
The final sample included 1,413,789 audiograms for workers employed by 25,908 U.S. companies during 2003–2012. Among 99% of audiograms for which information on the worker’s sex was available, 78% were recorded for males and 22% for females. A greater percentage of males had any hearing impairment (14%) than did females (7%), and the prevalence and severity of impairment increased with age (Table 2) for both sexes. Among all industries, 13% of noise-exposed workers had any impairment and 2% had moderate or worse impairment (Table 3). Workers with hearing impairment were represented in all industry sectors, with sharply decreasing numbers of workers with higher levels of impairment. The mining sector had the highest prevalence of workers with any impairment (17%) and with moderate or worse impairment (3%), followed by the construction sector (any impairment = 16%, moderate or worse impairment = 3%), and the manufacturing sector (14% and 2%). The public safety sector, which includes police protection, fire protection (including wildland firefighters), corrections, and ambulance services, had the lowest prevalence of workers with any impairment (7%).
Across all industries, 2.53 healthy years were lost annually per 1,000 noise-exposed workers (Table 3). Mild impairment accounted for 52% of all healthy years lost and moderate impairment accounted for 27%. Workers in the mining and construction sectors lost 3.45 and 3.09 healthy years per 1,000 workers, respectively. Overall, 66% of the sample worked in the manufacturing sector and represented 70% of healthy years lost by all workers. Public safety workers lost 1.30 healthy years per 1,000 workers, the fewest among all workers.
Discussion
Findings of increasing prevalence with age and a higher prevalence among males were expected and consistent with other research (2,4,8). Industry results highlight the high prevalence of hearing loss within the noise-exposed working population and the need for continued prevention efforts, especially in the mining, construction, and manufacturing sectors. The proportion of mining sector employees exposed to hazardous noise (76%) was the highest in any sector (3), and studies have consistently indicated elevated risks for occupational hearing loss within this sector (2,4). Occupational hearing loss risks have also been established within the construction sector (2,4); however, current noise regulations do not require audiometric testing for construction workers (2). Without testing to identify workers losing their hearing, intervention might be delayed or might not occur. Although a comparatively smaller percentage of manufacturing workers are noise-exposed (37%), this sector accounts for the most noise-exposed workers in the United States (3), and, as expected, the largest number of workers with hearing impairment. Some manufacturing sub-sectors, such as wood product, apparel, and machinery manufacturing, have been found to have occupational hearing loss risks as high as those in the mining and construction sectors (4). Another study using earlier GBD Study hearing impairment definitions also found the heaviest burdens of hearing impairment were in the mining, construction, and manufacturing sectors, indicating the most healthy years were lost in these sectors (8).Approximately 78% of the healthy years lost were attributable to mild or moderate hearing impairment. Preventing any occupational hearing loss is the best way to reduce worker hearing impairment over a lifetime, because even mild-to-moderate impairment during working years can culminate in more healthy years lost during retirement. Prevention also has short-term benefits; persons with even mild hearing loss experience reduced audibility (loudness), reduced dynamic range of hearing (the difference between the softest and loudest perceptible sounds), and increased listening fatigue (2). They also often experience difficulties understanding speech, especially in the presence of background noise (2). Other effects include degraded communication (2), cognitive decline (9), and depression (2).
In the general population, the prevalence of impairment also sharply decreases at higher levels of impairment, and severe impairment is not typically caused exclusively by noise. Some workers with a substantial hearing impairment might transfer away from noisy jobs because of difficulties communicating in noisy environments, or from jobs where hearing is critical for productivity and safety. For example, although the public safety sector had fewer older workers (lowering the prevalence), hearing impairment might have resulted in attrition because of the hearing-critical nature of many occupations in this sector (2).
The findings in this report are subject to at least seven limitations. First, this was a convenience sample and might not be representative of all noise-exposed workers tested in the United States. Second, not all noise-exposed workers are tested in the United States, especially in industries with high proportions of mobile or temporary workers, such as the construction and agriculture sectors. Third, in the absence of additional information, such as medical records, hearing impairment caused by occupational exposures can only be inferred. However, this inference was strengthened by studying exposed workers and excluding audiograms indicating nonoccupational exposures. Fourth, GBD Study disability weights were developed using international surveys asking respondents to compare life limitations posed by different health conditions, and to compare the value of preventing certain health conditions to the value of preventing death (5); respondents might not be able to appreciate the impact a disability can have on quality of life if they do not have that disability. Fifth, GBD Study audiometric definitions for impairment levels are conservative, with stringent requirements to reach even mild impairment. In addition, no impairment is identified when there is a total loss of hearing in one ear, and the impairment in the other ear can be lessened by hearing aid use. These limitations might have lowered impairment estimates, and worker impairment might be higher than reported here. Sixth, workers in the Occupational Hearing Loss Surveillance Project who wear hearing aids did not wear them during testing. However, few persons wear hearing aids during working years (9), so no adjustments were made for hearing aid use. Finally, no information was available on other conditions, so healthy years lost because of hearing impairment were not adjusted for comorbidities (5).
Occupational hearing loss is a permanent but entirely preventable condition with today's hearing loss prevention strategies and technology (2). Concurrent with prevention efforts, early detection of hearing loss by consistent annual audiometric testing, and intervention to preclude further loss (e.g., refitting hearing protection, training), are critical. Although lost hearing cannot be recovered, workers can benefit from clinical rehabilitation, which includes fitting hearing aids, learning lip-reading, and adopting other compensation strategies to optimize hearing. Study results support beginning rehabilitation at a mild level of hearing impairment. Prevention, and early detection, intervention, and rehabilitation, might greatly improve workers’ quality of life (2,9).
Acknowledgments
Jia Li, William Murphy, National Institute for Occupational Safety and Health, CDC; audiometric service data providers.
Corresponding author: Elizabeth A. Masterson, emasterson@cdc.gov, 513-841-4291.
1Division of Surveillance, Hazard Evaluations and Field Studies, National Institute for Occupational Safety and Health, CDC; 2Office of the Director, National Institute for Occupational Safety and Health, CDC; 3Division of Applied Research and Technology, National Institute for Occupational Safety and Health, CDC.
References
- Blackwell DL, Lucas JW, Clarke TC. Summary health statistics for US adults: National Health Interview Survey, 2012. Vital health statistics, series 10, no. 260. Atlanta, GA: National Center for Health Statistics, CDC; 2014. http://www.cdc.gov/nchs/data/series/sr_10/sr10_260.pdf
- Themann CL, Suter AH, Stephenson MR. National research agenda for the prevention of occupational hearing loss—part 1. Semin Hear 2013;34:145–207. CrossRef
- Tak S, Davis RR, Calvert GM. Exposure to hazardous workplace noise and use of hearing protection devices among US workers—NHANES, 1999–2004. Am J Ind Med 2009;52:358–71. CrossRef PubMed
- Masterson EA, Tak S, Themann CL, et al. Prevalence of hearing loss in the United States by industry. Am J Ind Med 2013;56:670–81. CrossRef PubMed
- Global Burden of Disease Study 2013 Collaborators. Global, regional, and national incidence, prevalence, and years lived with disability for 301 acute and chronic diseases and injuries in 188 countries, 1990–2013: a systematic analysis for the Global Burden of Disease Study 2013. Lancet 2015;386:743–800. CrossRef PubMed
- Masterson EA, Themann CL, Luckhaupt SE, Li J, Calvert GM. Hearing difficulty and tinnitus among US workers and non-workers in 2007. Am J Ind Med 2016;59:290–300. CrossRef PubMed
- World Health Organization. WHO methods and data sources for global burden of disease estimates 2000–2011. Global health estimates technical paper WHO/HIS/HSI/GHE/2013.4. Geneva, Switzerland: World Health Organization; 2013. http://www.who.int/healthinfo/statistics/GlobalDALYmethods_2000_2011.pdf
- Nelson DI, Nelson RY, Concha-Barrientos M, Fingerhut M. The global burden of occupational noise-induced hearing loss. Am J Ind Med 2005;48:446–58. CrossRef PubMed
- Chien W, Lin FR. Prevalence of hearing aid use among older adults in the United States. Arch Intern Med 2012;172:292–3. CrossRef PubMed
* Audiograms are the results of hearing tests.
†
Decibel is a unit of measure of the intensity (or loudness). The
A-scale is used because it corresponds better to the sound intensities
perceived by the human ear at low frequencies.
§
North American Industry Classification System (NAICS) codes range from
two-digit to six-digit numbers and industry specificity increases with
each digit (https://www.census.gov/eos/www/naics/).
¶
For morbid conditions, such as hearing impairment, the burden over a
one-year period is represented by a “disability weight” between 0 and 1,
representing life limitations as a lost fraction of a year of healthy
life. Because the most recent audiograms for workers were used to
characterize hearing impairment, the DALY results are an estimate of the
annual number of DALYs per 1,000 workers in the year of the last
audiogram, and a minimum estimate of DALYs in following years. Thus, the
DALY results are estimates of the annual DALYs per 1,000 workers as of
2012, the last year included in the analysis.
**
Tinnitus prevalences were estimated using results for U.S. noise-exposed
workers with daily or more frequent tinnitus comorbid with hearing loss
(http://onlinelibrary.wiley.com/doi/10.1002/ajim.22565/epdf) and proportions of the general population experiencing daily tinnitus by GBD Study level of hearing impairment (http://www.who.int/healthinfo/statistics/GlobalDALYmethods_2000_2011.pdf).
Tinnitus prevalence estimates for each level of hearing impairment
severity for the DALYs calculations were as follows: mild (18.40%);
moderate (26.58%); moderately severe (28.61%); severe (55.79%); profound
(56.42%); and complete (47.97%).
 TABLE 1. Hearing impairment audiometric definitions, and Global Burden of Disease (GBD) Study disability weights and lay descriptions
| Severity of hearing impairment | Audiometric definition* | GBD Study disability weight (no tinnitus) | GBD Study disability weight (with tinnitus) | GBD Study lay description (no tinnitus) | GBD Study lay description (with tinnitus) |
|---|---|---|---|---|---|
| Mild | 20–34 dB† average hearing threshold level across 500, 1,000, 2,000, and 4,000 Hz in the better ear | 0.01 | 0.021 | Has great difficulty hearing and understanding another person talking in a noisy place (for example, on an urban street) | Has great difficulty hearing and understanding another person talking in a noisy place (for example, on an urban street), and sometimes has annoying ringing in the ears |
| Moderate | 35–49 dB average hearing threshold level across 500, 1,000, 2,000, and 4,000 Hz in the better ear | 0.027 | 0.074 | Is unable to hear and understand another person talking in a noisy place (for example, on an urban street), and has difficulty hearing another person talking even in a quiet place or on the phone | Is unable to hear and understand another person talking in a noisy place (for example, on an urban street), has difficulty hearing another person talking even in a quiet place or on the phone, and has annoying ringing in the ears for 5 minutes at a time, almost every day |
| Moderately severe | 50–64 dB average hearing threshold level across 500, 1,000, 2,000, and 4,000 Hz in the better ear | Not calculated by GBD Study | Not calculated by GBD Study | Not generated by the GBD Study | Not generated by the GBD Study |
| Severe | 65–79 dB average hearing threshold level across 500, 1,000, 2,000, and 4,000 Hz in the better ear | 0.158 | 0.261 | Is unable to hear and understand another person talking, even in a quiet place, and unable to take part in a phone conversation. Difficulties with communicating and relating to others cause emotional impact at times (for example, worry or depression) | Is unable to hear and understand another person talking, even in a quiet place, is unable to take part in a phone conversation, and has annoying ringing in the ears for more than 5 minutes at a time, almost every day. Difficulties with communicating and relating to others cause emotional impact at times (for example, worry or depression) |
| Profound | 80–94 dB average hearing threshold level across 500, 1,000, 2,000, and 4,000 Hz in the better ear | 0.204 | 0.277 | Is unable to hear and understand another person talking, even in a quiet place, is unable to take part in a phone conversation, and has great difficulty hearing anything in any situation. Difficulties with communicating and relating to others often cause worry, depression or loneliness | Is unable to hear and understand another person talking, even in a quiet place, is unable to take part in a phone conversation, has great difficulty hearing anything in any situation, and has annoying ringing in the ears for more than 5 minutes at a time, several times a day. Difficulties with communicating and relating to others often cause worry, depression or loneliness |
| Complete | 95 dB or greater average hearing threshold level across 500, 1,000, 2,000, and 4,000 Hz in the better ear | 0.215 | 0.316 | Cannot hear at all in any situation, including even the loudest sounds, and cannot communicate verbally or use a phone. Difficulties with communicating and relating to others often cause worry, depression or loneliness | Cannot hear at all in any situation, including even the loudest sounds, and cannot communicate verbally or use a phone, and has very annoying ringing in the ears for more than half of the day. Difficulties with communicating and relating to others often cause worry, depression or loneliness |
Abbreviations: dB = decibel; Hz = hertz.
* These are the same as GBD Study audiometric definitions, except that the workers in this sample with hearing aids did not wear them during testing.
† dB is a unit of measure of the intensity (or loudness) of a sound.
* These are the same as GBD Study audiometric definitions, except that the workers in this sample with hearing aids did not wear them during testing.
† dB is a unit of measure of the intensity (or loudness) of a sound.
TABLE 2. Sample demographics for 1,413,789 workers in the United States,* with prevalence by hearing impairment severity,† 2003–2012
| Characteristic | Total (%) | No hearing impairment | Any hearing impairment (mild–complete) | Mild | Moderate | Moderately severe | Severe | Profound | Complete |
|---|---|---|---|---|---|---|---|---|---|
| No. (prevalence %) | No. (prevalence %) | No. (prevalence %) | No. (prevalence %) | No. (prevalence %) | No. (prevalence %) | No. (prevalence %) | No. (prevalence %) | ||
| Sex | |||||||||
| Male | 1,087,936 (78.11) | 929,487 (85.44) | 158,449 (14.45) | 132,434 (12.17) | 21,385 (1.97) | 3,625 (0.33) | 722 (0.07) | 204 (0.02) | 79 (0.01) |
| Female | 304,830 (21.89) | 282,700 (92.74) | 22,130 (7.26) | 18,941 (6.21) | 2,375 (0.78) | 560 (0.18) | 182 (0.06) | 57 (0.02) | 15 (<0.01) |
| Missing | 21,023 | NA | NA | NA | NA | NA | NA | NA | NA |
| Age group (yrs) | |||||||||
| 18–25 | 222,675 (15.75) | 218,724 (98.23) | 3,951 (1.77) | 3,299 (1.48) | 378 (0.17) | 166 (0.07) | 66 (0.03) | 27 (0.01) | 15 (0.01) |
| 26–35 | 333,461 (23.59) | 322,504 (96.71) | 10,957 (3.29) | 9,462 (2.84) | 974 (0.29) | 312 (0.09) | 128 (0.04) | 57 (0.02) | 24 (0.01) |
| 36–45 | 348,350 (24.64) | 320,260 (91.94) | 28,090 (8.06) | 25,020 (7.18) | 2,267 (0.65) | 564 (0.16) | 152 (0.04) | 69 (0.02) | 18 (0.01) |
| 46–55 | 330,934 (23.41) | 265,640 (80.27) | 65,294 (19.73) | 56,837 (17.17) | 6,962 (2.10) | 1,137 (0.34) | 275 (0.08) | 58 (0.02) | 25 (0.01) |
| 56–65 | 164,807 (11.66) | 98,403 (59.71) | 66,404 (40.29) | 52,935 (32.12) | 11,427 (6.93) | 1,717 (1.04) | 265 (0.16) | 49 (0.03) | 11 (0.01) |
| 66-–75 | 13,562 (0.96) | 5,280 (38.93) | 8,282 (61.07) | 5,777 (42.60) | 2,095 (15.45) | 365 (2.69) | 39 (0.29) | 5 (0.04§) | 1 (¶) |
| Missing | — | — | — | — | — | — | — | — | — |
Abbreviation: NA = not available.
* Worker representation in states of employment as condensed into six geographical regions based on the U.S. Embassy region groupings (http://usa.usembassy.de/travel-regions.htm) were the following: Mid-Atlantic with 244,930 workers (17.64%); Midwest with 641,487 workers (46.20%); New England with 11,255 workers (0.81%); South with 267,941 workers (19.30%); Southwest with 24,499 workers (1.76%); and West with 198,537 workers (14.30%). There were missing geographical region values for 25,140 workers.
† Hearing impairment severity audiometric definitions and lay descriptions are provided in Table 1. Hearing impairment was measured in the better ear.
§ This estimate has a relative standard error ≥30% and <50% and should be used with caution as it does not meet standards of reliability/precision.
¶ Estimate not shown as it has a relative standard error ≥50% and does not meet standards of reliability/precision.
TABLE 3. Annual
number of disability-adjusted life years (DALYs) per 1,000 workers,* by
industry sector, and estimated prevalence of workers with hearing
impairment and percent of DALYs, by severity level† and industry sector — 1,413,789 workers in the United States, 2003–2012
| Industry sector (NAICS 2007 Code) | Total (%) | DALYs/1,000 workers§ | Total % DALYs per sector¶ | Measure | Hearing impairment severity | |||||||
|---|---|---|---|---|---|---|---|---|---|---|---|---|
| No hearing impairment | Any hearing impairment (mild–complete) | Mild | Moderate | Moderately severe | Severe | Profound | Complete | |||||
| All industries | 1,413,789 (100) | 2.53 | 100.00 | No. (prevalence %) | 1,230,811 (87.06) | 182,978 (12.94) | 153,330 (10.85) | 24,103 (1.70) | 4,261 (0.30) | 925 (0.07) | 265 (0.02) | 94 (0.01) |
| % DALYs within sector | — | 100 | 51.64 | 26.66 | 4.83–22.38** | 5.58 | 1.82 | 0.69 | ||||
| Agriculture, forestry, fishing and hunting (11, except 115310) | 15,945 (1.13) | 2.17 | 0.97 | No. (prevalence %) | 14,171 (88.87) | 1,774 (11.13) | 1,492 (9.36) | 233 (1.46) | 31 (0.19) | 10 (0.06††) | 5 (0.03††) | 3 (§§) |
| % DALYs within sector | — | 100 | 51.88 | 26.49 | 3.51–16.55** | 6.06 | 3.37 | 2.16 | ||||
| Mining, quarrying, and oil and gas extraction (21) | 7,274 (0.51) | 3.45 | 0.70 | No. (prevalence %) | 6,058 (83.28) | 1,216 (16.72) | 994 (13.67) | 178 (2.45) | 33 (0.45) | 9 (0.12††) | 2 (§§) | — |
| % DALYs within sector | — | 100 | 47.57 | 27.95 | 5.24–24.46** | 7.72 | 1.92 | — | ||||
| Construction (23) | 35,969 (2.55) | 3.09 | 3.11 | No. (prevalence %) | 30,109 (83.71) | 5,860 (16.29) | 4,902 (13.63) | 805 (2.24) | 123 (0.34) | 27 (0.08) | 3 (§§) | — |
| % DALYs within sector | — | 100 | 53.01 | 28.56 | 4.47–20.72** | 5.23 | 0.62 | — | ||||
| Manufacturing (31–33) | 932,686 (66.01) | 2.66 | 69.52 | No. (prevalence %) | 804,548 (86.26) | 128,138 (13.74) | 107,514 (11.53) | 16,845 (1.81) | 2,933 (0.31) | 620 (0.07) | 180 (0.02) | 46 (<0.01) |
| % DALYs within sector | — | 100 | 52.09 | 26.80 | 4.78–22.15** | 5.38 | 1.78 | 0.49 | ||||
| Wholesale and retail trade (42, 44–45) | 110,299 (7.81) | 2.57 | 7.95 | No. (prevalence %) | 95,904 (86.95) | 14,395 (13.05) | 12,099 (10.97) | 1,832 (1.66) | 345 (0.31) | 85 (0.08) | 26 (0.02) | 8 (0.01††) |
| % DALYs within sector | — | 100 | 51.28 | 25.49 | 4.91–22.78** | 6.44 | 2.23 | 0.71 | ||||
| Transportation, warehousing and utilities (48, 49, 22) | 153,272 (10.85) | 1.54 | 6.60 | No. (prevalence %) | 141,181 (92.11) | 12,091 (7.89) | 10,186 (6.65) | 1,528 (1.00) | 290 (0.19) | 51 (0.03) | 20 (0.01) | 16 (0.01) |
| % DALYs within sector | — | 100 | 51.95 | 25.59 | 4.96–23.02** | 4.64 | 2.07 | 1.76 | ||||
| Healthcare and social assistance (62, except 62191) | 8,056 (0.57) | 2.69 | 0.61 | No. (prevalence %) | 7,020 (87.14) | 1,036 (10.51) | 847 (10.51) | 146 (1.81) | 34 (0.42) | 6 (0.07††) | 2 (§§) | 1 (§§) |
| % DALYs within sector | — | 100 | 46.94 | 26.43 | 6.19–29.06** | 5.80 | 2.22 | 0.99 | ||||
| Public safety (115310, 62191, 92212, 92214, 92216) | 13,974 (0.99) | 1.30 | 0.51 | No. (prevalence %) | 12,951 (92.68) | 1,023 (7.32) | 885 (6.33) | 111 (0.79) | 26 (0.19) | — | 1 (0.01) | — |
| % DALYs within sector | — | 100 | 58.66 | 24.05 | 5.69–26.64** | — | 1.13 | — | ||||
| Services (51–56, 61, 71–72, 81, 92 [except 92212, 92214, 92216]) | 135,524 (9.59) | 2.61 | 9.92 | No. (prevalence %) | 118,192 (87.21) | 17,332 (12.79) | 14,319 (10.57) | 2,409 (1.78) | 442 (0.33) | 116 (0.09) | 26 (0.02) | 20 (0.01) |
| % DALYs within sector | — | 100 | 48.62 | 26.87 | 5.04–23.39** | 7.04 | 1.79 | 1.47 | ||||
Abbreviations: GBD = Global Burden of Disease; NAICS = North American Industry Classification System.
* Annual number of DALYs per 1,000 workers represent how many years of healthy life were lost by 1,000 workers each year and can be compared across different health conditions.
† Hearing impairment severity audiometric definitions and lay descriptions are provided in Table 1. Hearing impairment was measured in the better ear.
§ DALYs were calculated by 1) applying the GBD Study disability weight with tinnitus to the number of workers estimated to have tinnitus; 2) applying the GBD Study disability weight without tinnitus to the number of workers estimated not to have tinnitus; and 3) adding these two values together for each industry sector and overall.
¶ Percent of total DALYs lost by all noise-exposed workers within each industry sector.
** The GBD Study did not calculate a disability weight for moderately severe hearing impairment. DALYs are presented as a range, applying the disability weight for moderate impairment to obtain the lower limit, and applying the disability weight for severe impairment to obtain the upper limit. The average of the lower and upper limits was used to calculate the total DALYs in each industry sector and overall.
†† This estimate has a relative standard error ≥30% and <50% and should be used with caution as it does not meet standards of reliability/precision.
§§ Estimate not shown as it has a relative standard error ≥50% and does not meet standards of reliability/precision.