


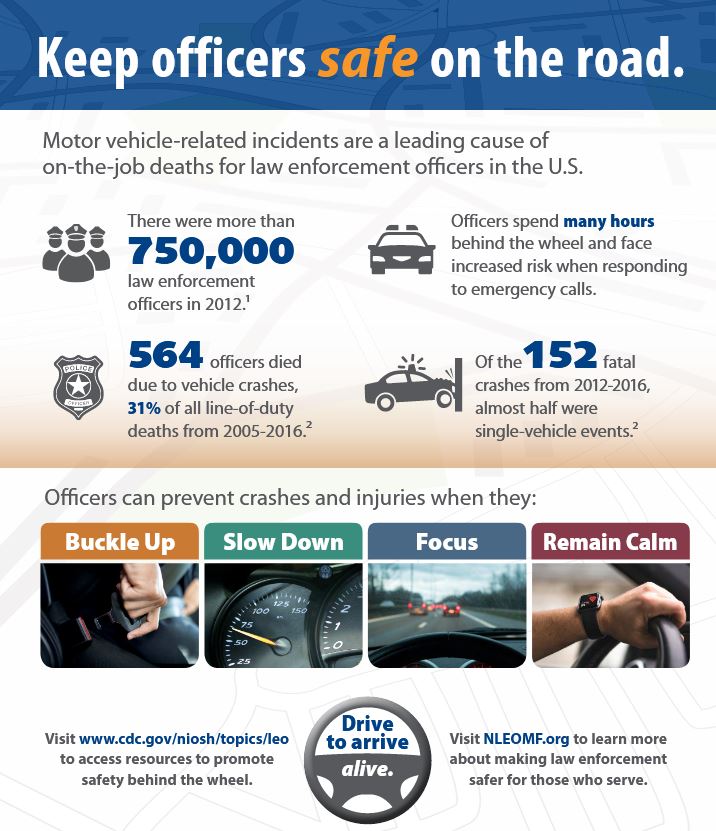
MOTOR VEHICLE-RELATED ACCIDENTS ARE A LEADING CAUSE OF ON-THE-JOB DEATHS OF LAW ENFORCEMENT OFFICERS IN THE U.S.
Executive Summary
The Law Enforcement Officers Killed & Assaulted (LEOKA) data, compiled by the Federal Bureau of Investigation, shows that the number of law enforcement officers (LEOs) killed in the line of dutyby violent means dominated those who were killed in motor vehicle crashes until the middle of the
1990s. However, the recent trend shows that motor vehicle crashes have become the major cause of
fatality of law enforcement officers. These observations suggested an in-depth analysis of the
data.
The Fatality Analysis Reporting System (FARS) is currently the only database that contains detailed
information on the fatal crashes that involved law enforcement officers. The characteristics of law
enforcement officers’ fatalities in motor vehicle crashes were investigated using the FARS data
from 1980 to 2008. The statistical analysis of the data found several important characteristics of
the law enforcement officers’ fatalities.
Regional Distribution
California recorded the highest number of LEO fatalities in motor vehicle crashes (107, 13.0%),followed by Texas (81, 9.8%), Georgia (43, 5.2%), New York (39,
4.7%), Alabama (36, 4.4%), Florida (35, 4.3%), and Tennessee (33, 4.0%).
Crash Level
The crashes with LEO fatalities in passenger vehicles occurred more frequently during dark hours (8p.m. to 4:59 a.m.), while the crashes with LEO fatalities on motorcycles occurred mostly during the
daylight hours from noon to 3:59 p.m.
In FARS, the first harmful event is defined as the first property damage (including to vehicles) or
injury producing crash event. The first harmful event data of the crashes with LEO fatalities in
passenger vehicles shows that “collision[s] with motor vehicle in-transport” decreased from 60
percent in the 1980s to 52 percent in the 1990s and to 48 percent in the 2000s. On the contrary,
“collision[s] with fixed object” such as boulder, guardrail, traffic barrier, etc., increased from
29 percent to 37 and then to 41 percent, respectively, in these three time periods. Rollovers
remained around 5 percent over the entire time period.
The FARS data on the manner of collision with a motor vehicle in-transport shows that more than
half of the passenger vehicle crashes resulting in LEO fatalities were angle crashes (55%) followed
by head-on crashes (27%), rear-end crashes (13%), and sideswipe crashes (5%). Motorcycle crashes
with LEO fatalities had mostly angle collisions (67%). Both head-on and rear-end collisions each
accounted for 13 percent and sideswipe 8 percent.
Fifty-four percent of the passenger vehicle crashes with LEO fatalities occurred on rural areas and
46 percent on urban areas. However, 89 percent of the motorcycle crashes with LEO fatalities
occurred on roadways in urban areas and only 11 percent
occurred on roadways in rural areas.
Vehicle Level
Rollover as a subsequent event accounted for 17 percent of the police passenger vehicles involving
LEO fatalities in the 1980s. However, it increased to 20 percent in the 1990s and to 26 percent in
the 2000s. As a result, rollover in total increased from 21 percent in the 1980s to 27 percent in
the 1990s and then to 31 percent in the 2000s.
Forty-seven percent of the police passenger vehicles involving LEO fatalities had “front” as the
initial impact point, 24 percent had “left side,” 13 percent had “right side,” and 7 percent had
“rear.” On the other hand, almost three-fourths (73%) of the initial impact point of the police
motorcycles involving LEO fatalities were “front.”
“Going straight” (61%) was the major vehicle maneuver type for the police passenger vehicles
involving LEO fatalities. This is followed by “negotiating curve” (19%) and “maneuvering to avoid
animal/pedestrian/object” (6%). In the case of motorcycles, “going straight” (71%) is followed by
“passing/overtaking another vehicle” (11%) and “negotiating curve” (8%).
Drivers of 37 percent of the police passenger vehicles and 29 percent of the police motorcycles
involving LEO fatalities did not attempt to avoid the crashes. In attempting to avoid the crashes,
13 percent of the police passenger vehicle drivers used steering; 6 percent used braking; and 10
percent used steering as well as braking. On the other hand, 19 percent of the police motorcycle
drivers used braking; 9 percent used steering; and 14 percent used both steering and braking.
Person Level
Of the law enforcement officers killed in passenger vehicle crashes, 28 percent used restraintsystems in the 1980s. The restraint system use increased to 56 percent in the 1990s, which is a
28-percentage-point increase. Recent data shows that the restraint system use decreased to 50
percent.
Air bags were deployed in 56 percent of the LEO fatalities in passenger vehicles in the 2000s,
which is a 29-percentage-point increase from 27 percent in the 1990s.
During the period from 1980 to 2008, 19 percent of law enforcement officers killed in passenger
vehicle crashes were ejected from the vehicles (15% totally ejected and 4% partially ejected).
The characteristics of fatalities in passenger vehicle crashes were compared between the LEO and
non-LEO groups using the FARS data. During the period from 2000 to 2008, the LEO and non-LEO group show substantially different characteristics at crash time, first harmful event, roadway function
class (rural/urban), roadway surface condition, emergency use, fire occurrence, rollover, most
harmful event, impact point, vehicle maneuver, crash avoidance maneuver, age, sex, person type,
seating position, restraint use, and air bag availability and deployment.