This blog presents Metropolitan Engineering Consulting & Forensics (MEC&F) claim management and claim investigation analyses of some of the typical claims we handle
EPA Issues Administrative Order
Requiring City to Construct Sewage Retention Tanks for Gowanus Canal Superfund
Site Cleanup
NEW
YORK
(March 30, 2021) The U.S. Environmental Protection Agency (EPA) ordered the
City of New York (city) to construct and operate two Combined Sewer Overflow
(CSO) retention tanks to control contaminated solids discharges at the Gowanus
Canal Superfund site in Brooklyn, New York, which is a key component of the
Gowanus Canal cleanup. The EPA’s order follows previous orders that EPA issued
in 2014 and 2016 to require the city to find a location for and design the two
tanks. Controls to reduce CSO discharges and prevent other land-based sources
of pollution, such as street runoff, from compromising the cleanup are a
critical part of the site’s cleanup plan.
“This
order will ensure that EPA’s cleanup efforts will not be undermined by
uncontrolled combined sewer overflow discharges that have contributed to the
chemical contamination of this waterway and impacted this community for the past
century and a half,” said
EPA Acting Regional Administrator Walter Mugdan. “To ensure the
integrity of the dredging work, the retention tanks will control New York
City’s sewer outfalls over the long-term.”
The
administrative order, issued on March 29, 2021, requires the city to construct
one 8-million-gallon tank, located at the head of the canal, and one
4-million-gallon tank, located at a New York City Department of Sanitation Salt
Lot near the middle of the canal.
The
order also requires the city to, among other things:
Ensure
that developers comply with municipal stormwater regulations within the
Gowanus area to prevent additional sewer volume from impairing the
effectiveness of the CSO tanks;
Provide
treatment for separated stormwater discharges;
Perform
monitoring of sewer solids discharges to ensure protection of the dredging
remedy;
Perform
associated maintenance dredging, if determined by EPA to be necessary;
Construct
a bulkhead on City-owned property to prepare for the second phase of
dredging work; and
Adhere
to an overall schedule for remaining tank design work and construction.
The
2013 cleanup plan for the Gowanus Canal Superfund site includes dredging to
remove contaminated sediment from the bottom of the canal, which has
accumulated because of industrial activity and CSO discharges. More than a
dozen contaminants, including polycyclic aromatic hydrocarbons, polychlorinated
biphenyls, and heavy metals, including mercury, lead, and copper, are present
at high levels in the Gowanus Canal sediments. Dredged sediment that contains
high levels of liquid tar will be thermally treated at an off-site facility and
disposed. The less contaminated dredged sediment will be processed at an
off-site facility to transform it into a beneficial use product, such as
landfill cover. Certain areas of the native sediment, below the original canal
bottom, that contain mobile liquid tar and are too deep to excavate, will be
mixed with cement and solidified to prevent the migration of the tar into the
water of the canal. Following dredging and solidification of areas of the
native sediment, construction of a multilayer cap in dredged areas will isolate
and prevent migration of any dissolved chemicals remaining in the deep native
sediments.
Cleanup work to resume next month at
Grasse River Superfund Site in Massena, New York
ALBANY,
NY (March
30, 2021) – The U.S. Environmental Protection Agency (EPA) announced today that
in-river work will resume next month to address sediment contaminated with
polychlorinated biphenyls (PCBs) at the Grasse River Superfund Site (aka Alcoa
Aggregation) in Massena, New York.
“It’s
exciting to see the tremendous progress that has been made as we near the
finish line for this critically important project,” said Walter Mugdan, Acting
Regional Administrator. “EPA, the New York State Department of
Environmental Conservation, and the Saint Regis Mohawk Tribe continue to work
together on the oversight of the various components of the project.”
In
2013, EPA selected a cleanup plan for the site that called for dredging and
capping of PCB‐contaminated sediment in a 7.2‐mile stretch of river. The 2021
work will primarily include placement of a 12-inch sand, gravel and/or stone
cap in the lower five miles of the main river channel from the Route 131 Bridge
to the mouth of the Grasse River, covering over 200 acres; sand backfilling in
areas dredged in 2020 near Snug Harbor; and habitat reconstruction throughout
the site. The major elements of the in-river work are expected to be completed
by the end of 2021. COVID-19 protocols will continue to be followed and
safeguards will be maintained for the protection of site workers and the
community.
To
support this year’s work, an extended underwater pipeline will be used to
transport some clean capping material from two staging areas to river
locations. This operation will occur 24 hours a day, six days a week. The
pipeline will be submerged along the river shoreline, with some floating
sections near the cap operations. The pipeline will be marked with orange and
white buoys. Designated crossing areas will be marked with green and red buoys
in the channel. The remainder of the capping material will be transported by
barges pushed by tugboats and placed mechanically on the river bottom using
excavator-type buckets. On-river warning signs will be posted to alert oncoming
boating traffic.
Information
on boater safety can be found on the Arconic project website: www.thegrasseriver.com.
Additional recreation advice is available from the New York State Department of
Health: “Recreation
Advice for Lower Grasse River During Dredging and Capping.” Recreational
boaters are asked to take caution, reduce speed and adhere to traffic patterns
in the project area.
A
limited amount of dredging will be conducted in the navigational channel in
2021 just downstream of Snug Harbor. Snug Harbor is a small embayment (an
embayment is a part of a body of water that extends beyond the general
shoreline) on the north shore of the Grasse River, located about a third of a
mile upstream from where it joins the St. Lawrence River. In 2020, EPA modified
its original cleanup plan to include removal of an additional 90,000 cubic
yards of sediment, instead of capping, from an area of the river near Snug
Harbor. This additional removal was needed to accommodate a new, larger tugboat
purchased by the St. Lawrence Seaway Development Corporation, which operates
its tugboat out of Snug Harbor. Dredging was substantially completed at Snug
Harbor in 2020. Approximately 110,000 cubic yards of sediment was removed from
20 acres of the river. Clean backfill material will be placed in this area in
2021.
Two
shoreline support areas will be used in 2021 to store and manage capping material;
one is the staging area located near the intersection of County Route 42 and
Route 131 in Massena and the other is a newly constructed staging area on
Haverstock Road. Clean capping material will be brought to these areas by truck
and transported by barge or pipeline to the cap placement equipment on the
river. As with previous phases of work, a traffic management plan will be
in place to address the increased truck traffic at and near the staging areas.
The Alcoa East Plant dock will also be used to support the project. While
efforts will continue to be made to minimize traffic impacts, residents should
exercise caution when driving in these areas.
Health
and safety plans have also been developed to protect workers and area
communities while work is underway. The air and river water will be monitored
during the work, and the results will be available on Arconic’s project
website: www.thegrasseriver.com.
Noise and lighting in the work zones will also be monitored. Efforts will
be made to mitigate noise generated from the construction activities. The
submerged pipeline is expected to help reduce noise levels associated with
capping operations during nighttime hours. Mechanical capping will be limited
to daytime hours.
Howmet
Aerospace Inc. (formerly Arconic Inc.) is responsible for performing the work
at the site on behalf of the parties responsible for the Superfund cleanup.
Advocacy group says some substances top
recommended health limits; most samples met standards set by the U.S.
Environmental Protection Agency
The latest tally of contaminants was 26 more than in the last report by the Environmental Working Group.
Drinking water supplied by New Jersey utilities between 2012 and 2017
contained 107 contaminants — some of which were at levels that
advocates say are harmful to human health, according to a survey published on Wednesday.
The advocacy organization Environmental Working Group used data from the state Department of Environmental Protection
on drinking water quality at New Jersey’s 579 utilities, as part of its
national U.S. Tap Water Database, a biennial report. The latest tally
of contaminants was 26 more than in the last report, covering the years
2010-2015, which was released two years ago.
In New Jersey, the report found some samples from larger utilities
contained contaminants at levels that exceeded health limits as
recommended by other states or by the nonprofit itself, although nearly
all samples met standards set by the U.S. Environmental Protection
Agency.
Although the samples were taken as long ago as 2012, the
contamination levels found are probably the same now unless a supply has
been treated, said Chris Campbell, vice president for information
technology at EWG.
“It is likely, barring installation of some form of treatment, that
the levels now are similar to 2015-2017, which is the timeframe used on
most contaminants,” he said.
The ‘Erin Brokovich’ chemical
The most common contaminant in New Jersey was hexavalent chromium,
the so-called “Erin Brockovich Chemical” — named after the well-known
public-health campaigner in California — that is used in the manufacture
of dyes, paints, inks and plastics, and can cause lung cancer if
regularly inhaled, according to federal health experts. The chemical was
found at above EWG-recommended health limits in the water of 202 New
Jersey utilities serving some 7.5 million people, the report said.
The second most common contaminant was bromodichloromethane, a
chemical formed when chlorine is used to disinfect drinking water, and
which has been linked in animal studies to cancer of the liver, kidneys
and intestines, according to federal scientists. In New Jersey, there
were 193 utilities serving some 5.1 million people where the chemical
was found at above EWG’s recommended health limits, the report said.
EWG bases many of its health recommendations on standards set by
California, or its own research. In New Jersey, there were 10
contaminants that exceeded the EWG-recommended health levels but only
two that exceeded federal legal limits, the report said.
Utilities where multiple contaminants were found included Atlantic City, which
had 10 chemicals that exceeded EWG’s health standards — the same number
as in the 2017 survey. Still, the city’s water met all federal health
requirements between January and March this year, the report said.
The Atlantic City contaminants included PFOS (perfluorooctane
sulfate), one of the potentially carcinogenic PFAS family of per- and
polyfluoroalkyl chemicals, at 33 times EWG’s recommended limit, and the
related chemical PFOA (perfluorooctanoic acid) at 12 times the limit.
The PFOA level was just within a new health limit that’s being adopted
by the Department of Environmental Protection, while the PFOS level
exceeded the state standard. EWG said it had no information on the
source of contamination at Atlantic City.
Meeting federal standards
Atlantic City’s water also contained arsenic at 31 times EWG’s health
guideline, and chloroform that was 40 times higher than the recommended
EWG health limit. Arsenic is the only one of the 10 contaminants in the
city’s water that’s subject to a federal legal limit of 10 micrograms
per liter.
Still, Atlantic City, whose water system serves about 152,000
customers, complied with federal standards on lead, the survey found.
Only 3.2% of the households sampled in Atlantic City exceeded the EPA’s
lead health limit of 15 parts per billion (ppb) during the latest
testing in 2017.
Among other utilities, New Jersey American Water’s western region system, serving some 264,000 people, also exceeded EWG’s health guidelines for 10 contaminants including hexavalent chromium and chloroform, neither of which have a legal limit.
New Jersey American Water said the substances identified by EWG in
its water are mostly by-products of water disinfectants, which meet all
regulatory requirements, and were previously reported to the DEP. Others
are chemicals in source water at levels well below “recognized” state
or federal drinking water standards.
“While we do not specifically treat for these unregulated compounds,
their presence is affected by the overall treatment process,” the
company said in a statement. “New Jersey American Water treats and
delivers water that meets or surpasses EPA and New Jersey drinking water
standards.”
Using California’s public health goals
The company’s president, Cheryl Norton, said the health limits
advocated by EWG often use California’s public health goals that are a
lot stricter than implemented state standards that take into account
other factors like detectability and the cost of treatment. For example,
she said California’s enforceable limit for arsenic is 2,500 times
higher than its public health goal and matches the federal level.
At Woodbridge-based Middlesex Water, serving about 233,000 customers, hexavalent chromium and PFOA were both found at above recommended levels.
Middlesex’s chief executive, Dennis Doll, said the report was in line
with the company’s own findings. “We don’t agree with the EWG’s
methodology but the results they are reporting are not an unreasonable
representation of our numbers,” he wrote in an email.
He noted that EWG’s health limits are recommendations, not
regulations, and so the reported levels do not violate any legal limit.
He called EWG’s proposed limit of 1 part per trillion (ppt) for PFOA
“outrageously low and not based on sound science.” The PFOA level in the
EWG report is based on only one Middlesex well, and so represents a
very small part of the company’s overall system, he said.
While the PFOA level in the Middlesex system topped EWG’s
recommendation, it was within the level that is being adopted by the
DEP.
Unsound science driving ‘race to zero’?
The Water Research Foundation, a national group that Doll chairs,
believes pressure on utilities and regulators from EWG and other
advocates is resulting in “a race to zero” that he said is not being
driven by sound science or EPA policy.
Still, EWG said the data shows that the EPA should set stricter
standards on drinking water contaminants. “Legal does not necessarily
equal safe,” the group said. “Getting a passing grade from the federal
government does not mean the water meets the latest health guidelines.”
For its part, the EPA said it has set enforceable maximum contaminant
limits (MCLs) for some chemicals including arsenic and chloroform, and
has issued a number of regulations since the 1995 amendments to the Safe
Drinking Water Act to reduce the risks of pathogens in ground water and
surface water, and from disinfection by-products.
On PFAS, the agency reiterated that it will decide by the end of this
year whether to begin regulating PFOA and PFOS, and is evaluating other
PFAS chemicals for possible regulation.
Andrea Drinkard, a spokeswoman for EPA, said the agency distinguishes
between the enforcement levels and “Maximum Contaminant Limit Goals”
(MCLGs), as set by the Safe Drinking Water Act. For example, the MCLG
for arsenic is zero because there is no level of arsenic in water that
is without risk, but the EPA has set 10 micrograms per liter as the
enforcement level “in accordance with SDWA requirements that EPA
consider the feasibility, costs, and benefits when establishing
regulations,” she said.
Different standards
Arsenic is one of 14 contaminants for which New Jersey has stricter limits than the EPA, according to the DEP’s Annual Compliance Report for 2018,
which describes the different standards that water utilities are
required to meet. That report names 49 water systems that exceeded
maximum contaminant limits for different chemicals during the year, and
another 29 that topped the EPA’s “action levels” on lead and copper.
The survey comes as New Jersey lawmakers and advocates step up their
efforts to renew aging water pipes and sewers that leak drinking water
and spill raw sewage during rainstorms. Municipal and investor-owned
water utilities are also working to ensure that public water supplies
are free of contaminants such as the lead that comes from antiquated
pipes, and the PFAS chemicals that persist in many water systems long
after their industrial uses have ended.
On Oct. 10, Gov. Phil Murphy set a target of replacing the state’s estimated 350,000 lead service lines
— pipes that connect individual homes with water transmission lines —
within 10 years. He proposed a $500 million bond to help utilities
comply with the target, which is expected to cost some $2 billion in
total.
Murphy’s initiative came on the same day as a major report on lead
from Jersey Water Works, a consortium dedicated to renewing the state’s
antiquated water infrastructure, and followed recent alarm over lead
contamination in Newark where authorities are already replacing lead
lines and helping residents install in-home filters.
Diarrheal diseases, caused primarily by unsafe water and poor sanitation, kill more children under 5 years old than malaria, AIDS, and measles combined.
Diarrheal disease kills one child every 60 seconds.
About a quarter (22%) of health facilities in Least Developed Countries have no safe water.
In sub-Saharan Africa, women and girls spend an estimated 40 billions hours a year collecting water.
An estimated 400 million school days are lost each year due to water-related diseases, with 272 million lost to diarrhea alone.
Lost time gathering water significantly reduces productive farming time
for women in parts of the developing world. With safe water nearby,
it’s estimated that women could feed 150 million of the world’s hungry.
For every $1 invested in safe water and sanitation, a yield of $5 to $28 USD is returned in increased economic activity and reduced health care costs. Access to safe water stimulates the economy for the long-term.
Launch of UN World Water Development Report 2021: determining the true value of the “blue gold” we need to protect.
Paris, 22 March — The United Nations World Water Development
Report (WWDR) 2021, published by UNESCO on behalf of UN-Water, shows
that the inability to recognize the value of water is the main cause of
water waste and misuse. Despite the difficulty of attributing an
objective and indisputable value to a resource which is fundamental to
life, it seems necessary to examine water’s various dimensions in order
to understand the various aspects of its “value”. This is especially
true in times of growing scarcity and against the backdrop of population
growth and climate change.
“Water is our most precious resource, a ‘blue gold’ to which more
than 2 billion people do not have direct access. It is not only
essential for survival, but also plays a sanitary, social and cultural
role at the heart of human societies,” says the Director-General of
UNESCO, Audrey Azoulay.
This year’s WWDR addresses the question of the value of water. It
shows that waste and careless use stems from the fact we all too often
think of water exclusively in terms of its cost price, without realizing
its tremendous value, which is impossible to price.
“The devastating effects of the COVID-19 pandemic remind us of the
importance of having access to water, sanitation and hygiene facilities,
and highlight that far too many people are still without them. Many of
our problems arise because we do not value water highly enough; all too
often water is not valued at all,” says Gilbert F. Houngbo, Chair of
UN-Water and President of the International Fund for Agricultural
Development (IFAD).
The value of water is certainly incalculable and limitless, since
life cannot exist without it and it has no replacement. This is perhaps
best illustrated by the widespread enthusiasm for the idea that traces
of water can be found on Mars, or the fact that we think of water and
life as interchangeable when studying other planets.
The report emphasizes the great need to broaden the notion of the
“value” of water stressing that we cannot confuse the concepts of
“price”, “cost” and “value”.
Although price and cost are potentially quantifiable, the concept of
“value” is much wider and includes social and cultural dimensions.
Indeed, water is not like other raw materials which can be treated as
commodities and openly traded through stock markets. The challenge is
to determine a value for a resource whose importance varies in different
areas of economic activity, at different times, without forgetting to
take into account its social, environmental and cultural dimensions.
Tools and methodologies for valuing water are both imperfect and misapplied
The tools we have today tend to reduce the value of water to its economic aspect.
The economic value of water cannot be denied considering its myriad
uses in food, electricity and industrial production, to name just a few.
While monetary valuation has the advantage of convenience and easy
legibility in agriculture and industry, it presents the disadvantage of
underestimating, even excluding, other aspects which are more difficult
to monetize. How do we quantify the meaning of the 443 million
schooldays missed annually due to water-related diseases?
Furthermore, some societies reject the idea of viewing nature and its
benefits from an economic perspective, putting the rights of “Mother
Earth” to the fore, thus rendering such economic readings of the value
of water woefully inadequate.
In India, for example, the Ganges is revered by Hindus as a living
entity with the same rights as human beings. Similarly, in New Zealand,
the Te Awa Tupua Act of 2017 recognizes the Whanganui River as “an
indivisible and living whole from the mountains to the sea” and
guarantees the river’s protection by the local Maori population. “The
fate of humans and water is inextricably linked. In the words of the
Whanganui River Tribe’s proverb, Ko au te awa, ko te awa ko au, I am the
river, the river is me”, notes Audrey Azoulay.
Faced with these views and those of investors, who consider that
resources such as water can have an economic value put on them, it
becomes difficult to develop a standard system to measure the value of
water in all its aspects. Nevertheless, it is possible to develop an
integrated approach that allows the different dimensions of water to be
considered together, so as to identify appropriate policy choices. A key
element of such an approach is to ensure that all stakeholders,
regardless of background or gender, are involved in evaluations and
decision-making. If we want to enrich our approach to water and stop
reducing the resource to its mere monetary value, we must be enriched by
the views held by all, especially the people directly concerned.
Overcoming differences of opinion and reaching the necessary
compromises is one of the great challenges of water management. “The
time has come for stakeholders to identify, articulate and share
perspectives of the values of water,” emphasizes UN-Water Chair, Gilbert
F. Houngbo. This implies developing mechanisms that allow stakeholders
not only to express themselves but also to be heard.
When major infrastructure projects are studied, for example, it is
essential to consider all these different dimensions, to ensure that
their social, cultural and environmental consequences are not
underestimated. A cost-benefit approach therefore requires considering
the different “values” of water.
Similarly, we know that providing universal access to safe drinking
water and sanitation in 140 low- and middle-income countries would cost
$114 billion per year, whereas the multiple social and economic benefits
of safe water are difficult to evaluate.
These issues are at the heart of this year’s edition of the United
Nations World Water Development Report (WWDR), UN-Water’s flagship
publication on water and sanitation issues, which focuses on a different
theme every year.
The report is published by UNESCO on behalf of UN-Water and its
production is coordinate by the UNESCO World Water Assessment Programme.
The report gives insight into the main trends concerning the state, use
and management of freshwater and sanitation, based on work by members
and partners of UN-Water.
Launched in conjunction with World Water Day, the report provides
decision-makers with knowledge and tools to formulate and implement
sustainable water policies. It also offers best practice examples and
in-depth analyses to stimulate ideas and actions for better stewardship
in the water sector and beyond.
Human health can be influenced by many factors, including exposure to
physical, chemical, biological, and radiological contaminants in the
environment. Protecting human health from environmental contaminants is
integral to EPA's mission.
EPA scientists evaluate the extent to which people are exposed to
contaminants in air, in water, and on land; how these exposures affect
human health; and what levels of exposure are harmful. The Agency uses
this information to develop guidelines for the safe production,
handling, and management of hazardous substances, and to determine
whether further study or public health intervention may be necessary.
EPA also tracks exposures and health condition across segments of the
population (such as gender, race, or ethnicity) or geographic location
to help identify differences across subgroups and guide public health
decisions and strategies.
This is consistent with national public health goals aimed at eliminating health disparities, and helps the Agency work toward environmental justice
by addressing a continuing concern that minority and/or economically
disadvantaged communities frequently may be exposed disproportionately
to environmental contaminants.
The ROE indicators address three fundamental questions regarding
trends in human exposure and disease or conditions that may be
associated with environmental factors. All three questions examined
trends across the U.S. population as a whole, as well as across
population subgroups and geographic regions:
Indicators: Exposure to Environmental Contaminant
What are the trends in human exposure to environmental contaminants?
Data on trends in exposure levels provide an opportunity to evaluate
the extent to which environmental contaminants are present in human
tissue, independent of the occurrence of specific diseases or
conditions.
What are the trends in health status in the United States?
Trends in general health outcome indicators (including life expectancy,
infant mortality, and general mortality) provide a broad picture of
health in the United States. These indicators provide a general context
for understanding trends in specific diseases and conditions that may in
part be linked with the environment.
The ROE exposure and health indicators are based on data sets
representative of the national population (rather than data from
targeted populations) and are not tied to specific exposures or
releases. They do not directly link exposure with outcome and,
consequently:
Cannot be used to demonstrate causal relationships between exposure to a contaminant and a particular health outcome.
Cannot be directly linked to any of the indicators of emissions or ambient pollutants in Air, Water, or Land.
However, when combined with other information, such as
environmental monitoring data and data from toxicological,
epidemiological, or clinical studies, these indicators can be an
important key to better understanding the relationship between
environmental contamination and health outcomes.
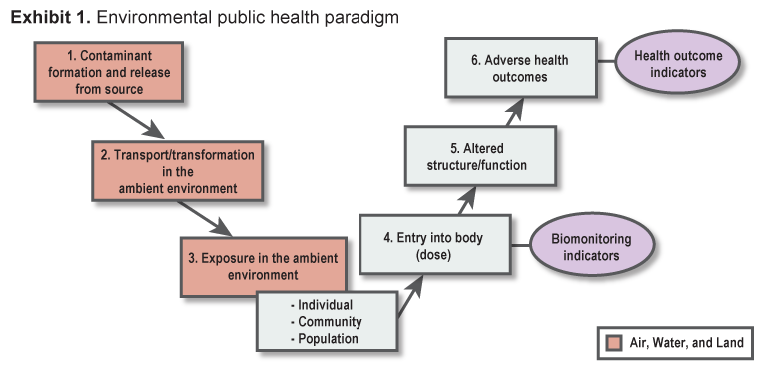
Environmental Public Health Paradigm
Development of disease is multi-faceted, and the relationship between
environmental contamination, exposure, and disease is complex. The
environmental public health paradigm shown in Exhibit 11
illustrates the broad continuum of factors or events that may be
involved in the potential development of human disease following
exposure to an environmental contaminant.
The presence of a contaminant in the environment or within human
tissue alone does not mean disease will occur. For adverse health
effects (clinical disease or death) to occur, a contaminant must:
Be released from its source (block 1);
Reach human receptors (via air, water, or land) (blocks 2 and 3);
Enter the human body (via inhalation, ingestion, or skin contact) (block 4), and:
Be present in the body at sufficient doses to cause biological
changes (block 5) that may ultimately result in an adverse health effect
(Block 6).
This series of events serves as the conceptual basis for understanding and evaluating environmental health. Air, Water, and Land
present indicators relevant to blocks 1-3. Indicators based on data
from individuals, communities, or populations (blocks 4-6) are the
domain of Human Exposure and Health.
The paradigm is a linear, schematic depiction of a process that is, in reality, complex and multi-factorial. For example:
Exposure to an environmental contaminant is rarely the sole cause of an adverse health outcome.
Environmental contaminant exposure is just one of several factors that
can contribute to the occurrence or severity of disease. Other factors
include diet, exercise, alcohol consumption, individual genetic makeup,
medications, and other pre-existing diseases. For example, asthma can be
triggered by an environmental insult, but environmental exposures are
not the “cause” of all asthma attacks. Consequently, the presence of a
disease or health outcome for which environmental contaminants are risk
factors does not mean exposure has occurred or contributed to that
disease.
Different contaminants can be risk factors for the same disease.
For example, both outdoor air pollution and certain indoor air
pollutants, such as environmental tobacco smoke, can exacerbate asthma
symptoms.
Susceptibility to disease is different for each person. Some individuals may experience effects from certain ambient exposure levels, while others may not.
Much remains unknown about the extent to which environmental contaminant exposures impact health.
Some environmental contaminants are considered important risk factors.
In other cases, available data suggest that environmental exposures are
important, but proof is lacking. And in other cases, the relationship
between the contaminant and human health, if any, is not known.
Connections Between Environmental Exposure and Health Outcomes
Relationships between environmental exposures and health outcomes can
only be established through well-designed epidemiological,
toxicological, and clinical studies. Developing evidence that
environmental contaminants cause or contribute to the incidence of
adverse health effects can be challenging, particularly for effects that
occur in a relatively small proportion of the population or effects
with multiple causes. For example:
In cases where exposure to an environmental contaminant results
in a relatively modest increase in the incidence of a disease or
disorder, a large sample size for the study would be needed to detect a
true relationship.
There may be factors related to both the exposure and the health
effect—confounding factors—that can make it difficult to detect a
relationship between exposure to environmental contaminants and disease.
In many cases, findings from studies in humans and/or laboratory
animals may provide suggestive (rather than conclusive) evidence that
exposures to environmental contaminants contribute to the incidence of a
disease or disorder.
Nevertheless, extensive and collaborative data collection and
research across the scientific community continue to strengthen
understanding of the relationships between environmental exposures and
disease.
EPA uses the results of scientific research to help identify linkages
between exposure to environmental contaminants and diseases,
conditions, or other health outcomes. These linkages, in turn, identify
environmental contaminants and health outcomes of potential Agency
interest. Research has established a relationship between exposure and
disease for some environmental contaminants including:
Radon and lung cancer.
Arsenic and cancer in several organs.
Lead and nervous system disorders.
Disease-causing bacteria (such as E. coli) and gastrointestinal illness and death.
Particulate matter and aggravation of cardiovascular and respiratory diseases.
These known linkages guided selection of the Human Exposure and
Health indicators in the ROE. However, because these indicators are
based on data sets representative of the national population (rather
than data from targeted populations) and are not tied to specific
exposures or releases, they do not directly link environmental exposure
with outcome.
[1] Adapted from: Sexton,
K., S.G. Selevan, D.K. Wagener, and J.A. Lybarger. 1992. Estimating
human exposures to environmental pollutants: Availability and utility of
existing databases. Arch. Environ. Health 47(6):398-407.
March 25 is both a national (revolution against the Turks) and religious holiday (Annunciation). March 25 is the nameday for Vangelis or Evangelos and Vangelio or Evangelia or Eva.
There is aschool flag paradein every town and village and a big armed forces parade in Athens , the capital of Greece .
The Byzantine Empire fell to the Turks in 1453 and the Greeks remained under the Ottoman rule for nearly 400 years. During this time their language, their religion and their sense of identity remained strong.
On March 25, 1821 the bishopGermanos of Patrasraised the Greek flag at the Monastery of Agia Lavra in Peloponnese and one more revolution started against the Turks. The people of Greece shouted "Freedom or Death" and they fought the War of Independence for 9 years (1821-1829) until a small part of modern Greece was finally liberated and it was declared an independent nation.
The struggle for the liberation of all the lands inhabited by Greeks continued. In 1864, the Ionian islands were added to Greece; in 1881 parts of Epirus and Thessaly. Crete, the islands of the Eastern Aegean and Macedonia were added in 1913 and Western Thrace in 1919. After World War II the Dodecanese islands were also returned to Greece.
- At the end of April 1825, Ibrahim Pascha began the siege of Messolongi, a town in central Greece. Finally, in the night of the 10th to 11th of April 1826 the defenders of the town, which were worn out by the twelve-month siege and the lack of food, attempted a desperate and at the same time heroic exodus. Read aboutthe last days before the exodus
The powerful administrative and military presence of the Ottoman Empire, the populous Muslim community which constituted almost the half of the population and the absence of preparations by the Philiki Etaireia were not in favour of a successful outbreak of the Greek Revolution. Nonetheless, from the end of Spring the revolutionary climate started being formed, especially in inapproachable areas of Chania (Sfakia) and Rethymnon (Anogeia). The Ottoman authorities soon learnt about these movements and proceeded with atrocities against the Christians obviously to intimidate and prevent the outbreak of a revolt. These actions had the contrary result and soon armed conflicts took place in different parts of the island. Sfakia, Anogeia and other mountainous areas constituted the main revolutionary centres and despite the fact that the Ottoman forces continued to control all the forts and strong strategic points of Crete, there was still tension until the first months of 1824. However, from the summer of the previous year (1823) Egyptian troops had landed on Crete and within the next months managed to resist by all means, confronting with great violence the Christian population. Since, the ports of Crete were used by Ibrahim Pasha as naval bases for the operations in the Peloponnese.
After more than three years, immediately after the destruction of the Egyptian fleet at Navarino (October 1827), the Greek Revolutionary Administration first and then the governor Ioannis Kapodistrias favoured the creation of revolutionary centres in different regions so that these could be included in the boundaries of the Greek state which were under negotiation. Thus, the uprising in Crete was boosted and upto the end of 1828 successful operations legalized the Greek claims on the island although they could not achieve military prevalence. Two years later the Egyptian powers repressed once again the revolt in Crete.
In the following decades more revolts followed: 1833, 1841, 1858, 1866, 1878, 1895.
Crete was liberated in 1897 and it remained an Autonomous Principality under prince George of Greece.
-About the Greek flag: "Freedom or Death" ( Eleftheria i Thanatos) was the motto during the Greek Revolution against the Ottoman Empire. It is believed that the nine lines of the flag reflects the number of syllables in the greek phrase "Eleftheria i Thanatos" = Freedom or Death.
The line pattern was chosen because of their similarity with the wavy sea that surounds the shores of Greece.The interchange of blue and white colors makes the Hellenic Flag on a windy day to look like the Aegean Sea. The Greek Square Cross that rests on the upper left-side ofthe flag demonstrates the respect and the devotion that Greek people have for the Greek Orthodox Church and signifies the important role of Christianity in the formation of the modern Hellenic Nation. During the dark years of the Ottoman rule, the Greek Orthodox Church helped the enslaved Greeks to retain their cultural characteristics: the Greek language, the Byzantine religion and generally the Greek ethnic identity. Today, Christianity is still the dominant religion among Greeks. Therefore the existence of the Cross is justified.
-The Greek National Anthem:Hymn to Liberty (Imnos stin Eleftheria)
in Greek
Latin Transliteration
English Translation
Se gnorizo apo tin kopsi, Tou spathiou tin tromeri, Se gnorizo apo tin opsi, Pou me via metra tin yi. Ap' ta kokala vgalmeni, Ton Ellinon ta iera, Ke san prota andriomeni, Haire, o haire, Eleftheria! (repeat previous two lines three times)
We knew thee of old, Oh, divinely restored, By the lights of thine eyes, And the light of thy Sword, From the graves of our slain, Shall thy valour prevail, As we greet thee again- Hail, Liberty! Hail! (repeat previous two lines three times)


 On March 25, 1821 the bishop
