COMMONWEALTH OF PENNSYLVANIA
Dept. of Environmental Protection
Commonwealth News Bureau
Room 308, Main Capitol Building
Harrisburg PA., 17120
FOR IMMEDIATE RELEASE
08/17/2016
CONTACT:
Neil Shader, DEP
717-787-1323
2014 Air Emissions Inventory for Unconventional Natural Gas Operations Released
The
inventory represents 2014 emissions from Marcellus Shale natural gas
production and processing operations as well as compressor stations that
receive gas from coal gas, conventional, and unconventional well sites.
Air emissions from the industry are required to be reported to DEP
under Pennsylvania’s Air Pollution Control Act.
“As
pipeline infrastructure and natural gas production continues to grow in
Pennsylvania, it is increasingly important that we ensure that natural
gas stays in those pipelines and other facilities and isn’t leaking into
our communities,” DEP Acting Secretary Patrick McDonnell said. “With
universal adoption of best practices that many companies are already
using, we expect leaks to go down even as production goes up.”
According to the recently released 2015 Annual Oil and Gas Report, production from unconventional gas wells increased significantly, from 3.1 trillion cubic feet of gas to 4.1 trillion cubic feet.
“Additionally,
the types and number of gas-related facilities from which we collect
data has increased since the first inventory in 2011,” said McDonnell.
The data reported for six major categories of contaminants are provided below:
UNCONVENTIONAL NATURAL GAS EMISSIONS BY YEAR
Expressed in Tons per Year
|
Year
|
Well Sites Reporting
|
Midstream Facilities Reporting
|
Carbon Monoxide (CO)
|
Nitrogen Oxides (NOx)
|
Particulate Matter (PM10)
|
Sulfur Dioxide (SO2)
|
Volatile Organic Compounds (VOC)
|
Methane(CH4)
|
|
2011
|
9,037
|
150
|
6,852
|
16,542
|
577
|
122
|
2,820
|
NA
|
|
2012
|
8,966
|
453
|
7,350
|
16,361
|
600
|
101
|
4,024
|
123,884
|
|
2013
|
10,275
|
447
|
6,606
|
17,659
|
670
|
159
|
4,790
|
107,945
|
|
2014
|
10,009
|
508
|
8,230
|
21,663
|
864
|
263
|
6,389
|
109,555
|
The
number of midstream facilities that submitted data in 2014 increased by
12 percent – from 447 to 508 reporting facilities, while the number of
well sites reporting dropped 2.7 percent – from 10,275 in 2013 to 10,009
in 2014.
From
2013 and 2014, there was an increase from unconventional natural gas
operations of nitrogen oxides (18%), fine particulate matter (25%),
sulfur dioxide (40%), volatile organic compounds (25%), methane (1%),
and carbon monoxide (19%). However, these emissions represent only a
fraction of all emissions from all industries in Pennsylvania.
“Although
the reported emissions from the natural gas sector increased in 2014,
overall our air quality continues to improve due to emissions reductions
from other point sources such as electric generating units,” McDonnell
said. “Between 2011 and 2014, NOx and SO2
emissions from electric generating units have decreased by 18 percent
(27,246 tons per year) and 17 percent (54,973 tons per year),
respectively. We remain committed to developing and implementing the
most effective ways to control and reduce emissions from Pennsylvania’s
natural gas sites.”
In
2014, there was a slight (1%) increase in reported methane emissions, a
highly potent greenhouse gas that contributes to climate change. In January, Governor Tom Wolf announced an ambitious strategy
to reduce emissions of methane from natural gas well sites, processing
facilities, compressor stations and along pipelines through
state-of-the-art leak detection programs, best operational practices and
updated permitting requirements.
DEP
began collecting emissions data from owners and operators of
unconventional natural gas sources in 2011. In 2012, DEP expanded the
data reporting requirement to include midstream compressor stations that
support the conventional natural gas industry. DEP again expanded the
reporting requirements in 2013 to include data from mid-stream
compressor stations that support coal-bed methane formations.
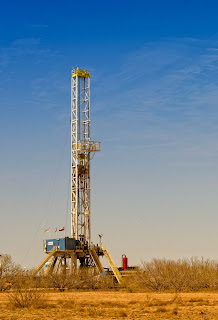
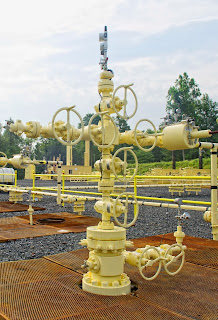
In
addition to compressor stations, other sources and activities of
natural gas operations that DEP identified as part of the inventory
include dehydration units; drill rigs; fugitive emission sources, such
as connectors, flanges, pump lines, pump seals and valves; heaters;
pneumatic controllers and pumps; stationary engines; tanks, pressurized
vessels and impoundments; venting and blow down systems; well heads and
well completions.
To view the complete emissions inventory summarized by company, source category, county and well farm, visit DEP’s website at http://www.dep.pa.gov/Business/Air/BAQ/BusinessTopics/Emission,
and click on the “Annual Emissions Data from Natural Gas Operations”
link under the topic “Natural/Coal Bed Methane Gas Operations.”
###


