
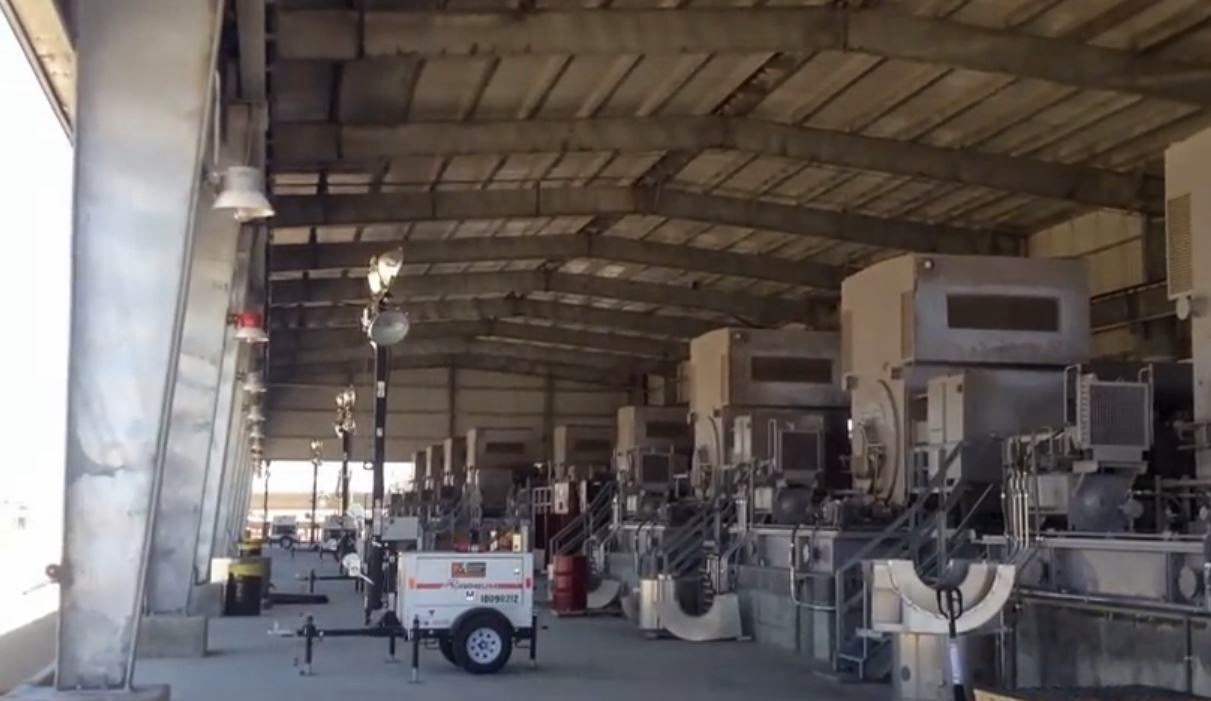
METROPOLITAN ENGINEERING has worked on numerous assignments to
model and reduce the noise (environmental and workplace) of several gas
compressor stations in across the United States.
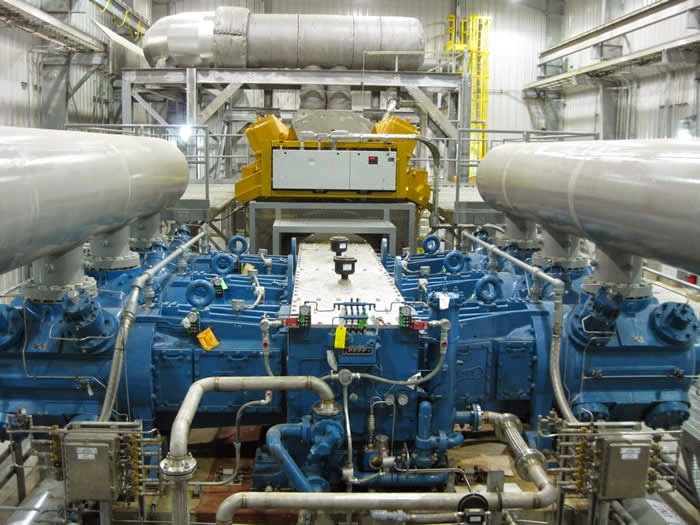
The typical project starts with input data collection by means of
measuring the Sound Power Level of the main sources of the facility. Sound
power or acoustic power is a
measure of sound energy per time unit. It
is the power of the sound force on a surface of the medium of propagation of
the sound wave. For a sound source, unlike sound pressure, sound power is
neither room dependent nor distance dependent. Sound pressure is a measurement
at a point in space near the source, while sound power is the total power
produced by the source in all directions.
Sound power, denoted P
and measured in W,
is given by:

where:
·
f
is the sound force, measured in N
of unit vector u;
·
v
is the particle velocity, measured in m·s−1;
·
A
is the area, measured in m2;
·
p
is the sound pressure, measured in Pa.
Table of selected sound sources
Situation and
sound source |
Sound power
(W) |
Sound power level
(dB ref 10−12 W) |
Saturn V rocket
|
100,000,000
|
200
|
Turbojet engine
|
100,000
|
170
|
Turbofan aircraft at take-off
|
1,000
|
150
|
Turboprop aircraft at take-off
|
100
|
140
|
Machine gun
Large pipe organ |
10
|
130
|
1
|
120
|
|
Rock concert
Chain saw
Accelerating motorcycle |
0.1
|
110
|
Lawn mower
Car at highway speed Subway |
.01
|
100
|
Large diesel vehicle
Heavy city traffic |
0.001
|
90
|
Alarm clock
|
0.0001
|
80
|
Noisy office
Vacuum cleaner |
10−5
|
70
|
Busy restaurant
Hair dryer |
10−6
|
60
|
Quiet office
Average home |
10−7
|
50
|
Refrigerator
low voice Quiet home |
10−8
|
40
|
Quiet conversation
Broadcast studio |
10−9
|
30
|
Whisper
Wristwatch ticking |
10−10
|
20
|
Human breath
|
10−11
|
10
|
Threshold of hearing
Reference Power Level |
10−12
|
0
|
[1]Usable
music sound (trumpet) and noise sound (excavator) both have the same sound
power of 0.3 watts, but will be judged psychoacoustically
to be different levels.
Sound Power and Sound Pressure
"Sound power" and "sound pressure" are two
distinct and commonly confused characteristics of sound. Both share the same
unit of measure, the decibel (dB), and the term "sound level" is
commonly substituted for each. However, to understand how to measure and
specify sound, the Motor system designer must first understand the difference
between these properties.
To obtain the maximum benefit from sound power level (Lw)
ratings, an engineer must understand what Lw ratings represent and how
to apply them properly. For the design engineer who is not yet familiar with
the techniques of applying Lw ratings, this article may serve as a brief
introduction.
Sound Power Ratings
Sound power is the acoustical energy emitted by the sound
source, and is an absolute value. It is not affected by the environment.
Motor Lw ratings are obtained from the determination of
sound power levels generated by a motor when it is operated at no load. These
sound power levels are obtained in accordance with IEEE 85. What is heard is a
sound pressure level that is determined, for any particular location, by many
factors, including size of the room, nature of its walls, ceilings,
furnishings, etc. The pressure level at the point of hearing is also related to
the distance from the sound source. The motor is the starting point, and when
proper and accurate consideration is given to the other components of the
system, sound power level ratings in octave bands will allow calculation of the
resulting sound pressure levels in the space.
Sound power levels are connected to the sound source and
independent of distance. Sound powers are indicated in decibel.
Lw = 10 log (W / W0)
where:
W0 = reference power (W)
The normal reference level is 10-12 W, which is the lowest sound persons of excellent hearing can discern. Sound power is measured as the total sound power emitted by a source in all directions in watts (joules / second).

Sound Pressure Level
Sound pressure is a pressure disturbance in the atmosphere
whose intensity is influenced not only by the strength of the source, but also
by the surroundings and the distance from the source to the receiver. Sound
pressure is what our ears hear, what sound meters measure ... and what
ultimately determines whether a design achieves quality sound.
The sound pressure level in a space may be estimated when
sufficient information is available from the Lw of motor and the
acoustical characteristics of the space. A proper acoustical calculation
requires the use of the motor Lw stated separately for each of the eight
octave bands. Each octave band level is usually different, and the room
acoustical characteristics also vary with frequency.
Since sound measuring instruments respond to sound pressure the
"decibel" is generally associated with sound pressure level.
Sound pressure levels quantify in decibels the intensity of given sound
sources. Sound pressure levels vary substantially with distance from source,
and also diminish as a result of intervening obstacles and barriers, air
absorption, wind and other factors.
Sound Pressure Level (SPL) =

where po = 2x10⁻⁵ N/m2.
p = root mean square pressure (N/m2)
The usual reference level po is 20x10-6
N/m2. Note that the noise from motors is documented in sound power
level. "Threshold of audibility'' or the minimum pressure
fluctuation detected by the ear is less than 10-9 of atmospheric
pressure or about 20x10-5 N/m2 at 1000 Hz.
"Threshold of pain'' corresponds to a pressure 106 times
greater, but still less than 1/1000 of atmospheric pressure. Because of
the wide range, sound pressure measurements are made on a logarithmic scale
(decibel scale).

Relating Power to Pressure
Equipment sound power ratings are determined in an acoustics laboratory,
usually by the manufacturer. Specific standards qualify testing facilities and
methods to promote data uniformity and objective comparisons of different units
across the industry.
By contrast, sound pressure can be measured in an existing space
with a sound meter, or predicted for a space not yet constructed by means of an
acoustical analysis. Since the only accurate sound data a manufacturer can
provide is expressed as sound power, the challenge of designing for quality
sound is to examine the effect of environmental factors.
An Illuminating Analogy
The following comparison of sound and light may help illustrate
the distinction between these terms. Think of sound power as the wattage rating
of a light bulb; both measure a fixed amount of energy. Sound pressure
corresponds to the brightness in a particular part of the room; both can be
measured with a meter and the immediate surroundings influence the magnitude of
each. In the case of light, brightness is more than a matter of bulb
wattage.
Asking for a 90 dBA motor is a lot like asking for a “light:” you don’t know what you are going to get. Most of us are much more familiar with light than sound. If someone says he has a 100-watt light bulb, you have some idea of the candlepower available, but if you want to read by the light, you want to know the light intensity level at the reading location. To determine the light intensity level you would need to know:
Asking for a 90 dBA motor is a lot like asking for a “light:” you don’t know what you are going to get. Most of us are much more familiar with light than sound. If someone says he has a 100-watt light bulb, you have some idea of the candlepower available, but if you want to read by the light, you want to know the light intensity level at the reading location. To determine the light intensity level you would need to know:
“How far away is the light?” If the light is a mile away, it is
not much use. The analogous sound question is “How far away is the motor?”
“Is the light outdoors?” With no walls to reflect the light,
all but the direct light radiates out into the free field of space. The
analogous sound question is “Is the motor outdoors?”
“Are the room walls reflective if the light is not outdoors?” A
room covered with black velvet would not reflect much light regardless of its
size. The analogous sound question is “How reverberant are the walls?”

Motor dBA Rating
The term dBA applies to sound pressure. The sound pressure
immediately around a motor depends on a number of variables. Sound pressure can
only be calculated from the motor sound power rating when using known
variables. Motor manufacturers indicate the noise level of their products by
sound pressure levels expressed in dBA. These figures refer to the sound
pressure levels that should be experienced by an observer at a certain distance
from the motor in a given environment, which is generally assumed to be a free
field.
These values should only be used to compare noise levels of similar types of motors at the same distance, and in the same environment. Do not assume that the dBA levels on the performance data will in any way be similar to those achieved in practice. Depending on circumstances, they can be substantially exceeded.
These values should only be used to compare noise levels of similar types of motors at the same distance, and in the same environment. Do not assume that the dBA levels on the performance data will in any way be similar to those achieved in practice. Depending on circumstances, they can be substantially exceeded.
Sound Power to Pressure Conversion Rule of Thumb
TYPICAL FREE FIELD
SOUND PRESSURE
VERSUS SOUND POWER LEVELS - IN dB
VERSUS SOUND POWER LEVELS - IN dB
FRAME SERIES
|
POWER LEVEL
|
PRESSURE LEVEL @ 3 FT
|
PRESSURE LEVEL @ 5 FT
|
140
|
X
|
X - 7.8
|
X - 10.6
|
180
|
X
|
X - 8.0
|
X - 10.8
|
210
|
X
|
X - 8.2
|
X - 10.9
|
250
|
X
|
X - 8.4
|
X - 11.1
|
280
|
X
|
X - 8.8
|
X - 11.4
|
320
|
X
|
X - 9.0
|
X - 11.6
|
360
|
X
|
X - 9.2
|
X - 11.8
|
400
|
X
|
X - 9.5
|
X - 12.0
|
440
|
X
|
X - 10.9
|
X - 12.4
|
5000
|
X
|
X - 10.6
|
X - 12.8
|
5800
|
X
|
X - 11.6
|
X - 13.7
|
6800
|
X
|
X - 11.9
|
X - 13.9
|
8000
|
X
|
X - 12.5
|
X - 14.7
|

Calculating Sound Pressure
Sound instruments measure only sound pressure; this pressure
varies depending on the surroundings. To calculate sound pressure from sound
power, one must consider all the variables that affect sound pressure. The
relationship between sound power level (sound energy emitted by the motor and
sound pressure (what is heard) at a specific location.
Human Response
Ear sensitivity varies with frequency. A low frequency sound at
a certain power does not seem as loud as a higher frequency sound of the
identical power. To account for this difference, a weighting scale has been
developed. Sound power levels adjusted by this specific weighting scale are
called A-weighted. Sound power levels in eight octave bands are
calculated to a single A-weighted sound power number, LWA.
Free Field Ratings
Because one environment, a free field, can be easily defined,
it is sometimes used to specify desired sound pressure levels. If a motor is
placed on the ground in a large open field, all of its sound radiates out in a
hemispherical free field with no sound reflected back. These conditions are
fully defined, and it is possible to convert motor sound power to sound
pressure at a specified distance.
As distance from the motor increases, sound pressure decreases; so it is important to include distance from the motor when asking for a dBA rating. If you specify a hemispherical free field but do not specify a distance, it is possible to make a loud motor appear quieter by calculating its sound pressure level at a distance farther away from the motor. For example, Motor A calculates to 90 dBA at a distance of 3 m (10 ft) in a hemispherical free field. Another motor, Motor B, with a sound power level 12 dB higher than Motor A, will also calculate to 90 dBA, but at 12 m (40 ft) from the motor.
As distance from the motor increases, sound pressure decreases; so it is important to include distance from the motor when asking for a dBA rating. If you specify a hemispherical free field but do not specify a distance, it is possible to make a loud motor appear quieter by calculating its sound pressure level at a distance farther away from the motor. For example, Motor A calculates to 90 dBA at a distance of 3 m (10 ft) in a hemispherical free field. Another motor, Motor B, with a sound power level 12 dB higher than Motor A, will also calculate to 90 dBA, but at 12 m (40 ft) from the motor.
Multiple Sources
Two equal sources produce a 3 dB increase in sound power
level. Two equal sources produce a 3 dB increase in sound pressure level,
assuming no interference. Two 80 dB sources add to produce an 83 dB SPL.
Noise Modeling
For the purpose of noise modelling the operating time of the
noise sources is taken into account in every time period of the day. The governing factors in relation to the
atmospheric absorption are the relative humidity and the temperature of the
air.
To calculate the long term equivalent level as needed for noise modelling a meteorological correction will be applied. This correction is dependent on the location, and is determined by meteorological data collection and a calculation method developed by METROPOLITAN engineers.
To calculate the long term equivalent level as needed for noise modelling a meteorological correction will be applied. This correction is dependent on the location, and is determined by meteorological data collection and a calculation method developed by METROPOLITAN engineers.
Noise model calculations for environmental and workplace noise
will be done with SoundPLAN - the market leader in noise mapping software.
The goals of the project are to determine the baseline noise
level with modelling and to find cost-effective solutions for noise reduction. In the noise reduction ActionPLAN model
calculations will be used to demonstrate the effect of the proposed noise
reduction measures.

Main advantages of modelling
·
cost-effectiveness: modelling can substitute
hundreds of measurements
·
large possibilities: presentation of the results
at any chosen location possible, any selected scenario can be modelled
·
presentation of the future: the emission load of
not only present but future developments can be presented
·
presentation of the achievable noise reduction:
the results of the ActionPLAN can be presented before implementation
·
noise calculations in and outside: noise coming
from the outside sources can be modelled inside buildings such as control
rooms, workshops, warehouses, etc.

Noise measurement
METROPOLITAN is equipped with the latest computer-based noise
measurement and data logging equipment to assess the noise impact of a wide
variety of developments and activities.
We have building acoustics instrumentation for the testing of
walls and floors.
Our instrumentation can be used for both data logging (long
term noise monitoring) and attended measurements, allowing noise assessments to
be tailored to meet the specific needs of clients.
We have multi-channel noise measurement instrumentation so that
sources can be simultaneously measured at four locations. This can be used for environmental noise
monitoring, vehicle pass-by testing and building acoustics measurements.
Multi-channel measurement allows us to carry out noise
insulation measurements according to ISO140-5 for either internal walls or for
external elements such as windows, doors and facades using traffic, train and
aircraft noise as sources.
Measuring the transmission loss ratings of panels is carried out with instrumentation using speakers as sound sources (for the transmission loss of internal walls). We use transportation noise sources (eg aircraft) using ISO140 to assess the transmission loss of windows and doors installed in buildings. Tri-axial vibration measurements are carried out using the same analyzer.
Measuring the transmission loss ratings of panels is carried out with instrumentation using speakers as sound sources (for the transmission loss of internal walls). We use transportation noise sources (eg aircraft) using ISO140 to assess the transmission loss of windows and doors installed in buildings. Tri-axial vibration measurements are carried out using the same analyzer.
We
have designed the facades of buildings near roads and rail
lines using our PC based noise instrumentation. For a residential
development adjacent to a proposed
compressor station, we identified the actual nature of the problem using
instrumentation that simultaneously stores the noise data on a notebook
computer and makes an audio recording of the noise source for later
analysis. By making measurements before and after the compressor
building insulation we were able to play an audio recording that
demonstrated
the reduction in noise due to the insulation as well as show the overall
reduction in noise in decibels.

Metropolitan
Engineering, Consulting & Forensics (MECF)
Providing
Competent, Expert and Objective Investigative Engineering and Consulting
Services
P.O. Box
520
Tenafly,
NJ 07670-0520
Tel.:
(973) 897-8162
Fax:
(973) 810-0440
E-mail:
metroforensics@gmail.com
We are happy to
announce the launch of our twitter account. Please make sure to follow us at
@MetropForensics or @metroforensics
Metropolitan
appreciates your business.
Feel
free to recommend our services to your friends and colleagues.